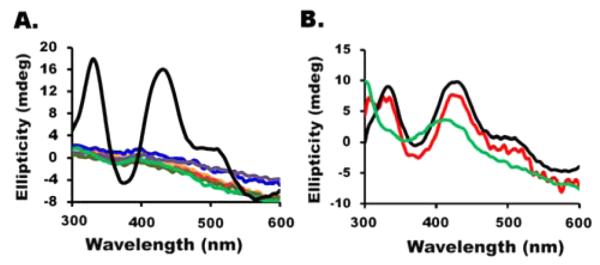
Figure 4.

CD features for M2 (Figure 3), control, and DTT-spiked reaction mixtures. (A) The CD spectrum for [2Fe-2S]-ISCU2 for the M2 sample is colored black. CD spectra are overlaid for control reactions that include Fe(NH4)2(SO4)2 and Na2S (orange), FeCl3 and Na2S (red), Fe(NH4)2(SO4)2, Na2S, and DTT (blue), FeCl3, Na2S, and DTT (purple), Fe(NH4)2(SO4)2, Na2S, and cysteine (dark green), and FeCl3, Na2S, and cysteine (light green). (B) The [2Fe-2S]-ISCU2 signal was generated for the SDUF sample under DTT-free conditions (black). DTT (4 mM) was added, and the spectra were recorded after 2 (red) and 5 (green) min.
