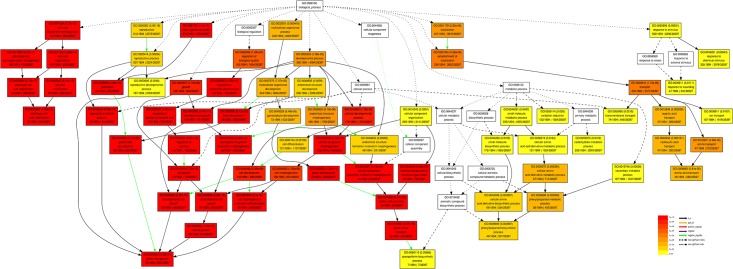
Fig 3. Hierarchical tree graph of overrepresented GO terms in the biological process sub-category.
This was found to be enriched in WSLA and WSLB using agriGO (http://bioinfo.cau.edu.cn/agriGO/, Du et al., 2010). Boxes in the graph represent GO terms labeled according to their GO ID, term definition, and statistical information. Significant terms (adjusted P ≤ 0.05) are in color (red, orange, or yellow), while non-significant terms are shown as white boxes. In the diagram, the degree of color saturation of a box is positively correlated with the enrichment level of the term. Solid, dashed, and dotted lines represent two, one, and zero enriched terms at both ends connected by the line, respectively. The rank direction of the graph is set from top to bottom.

