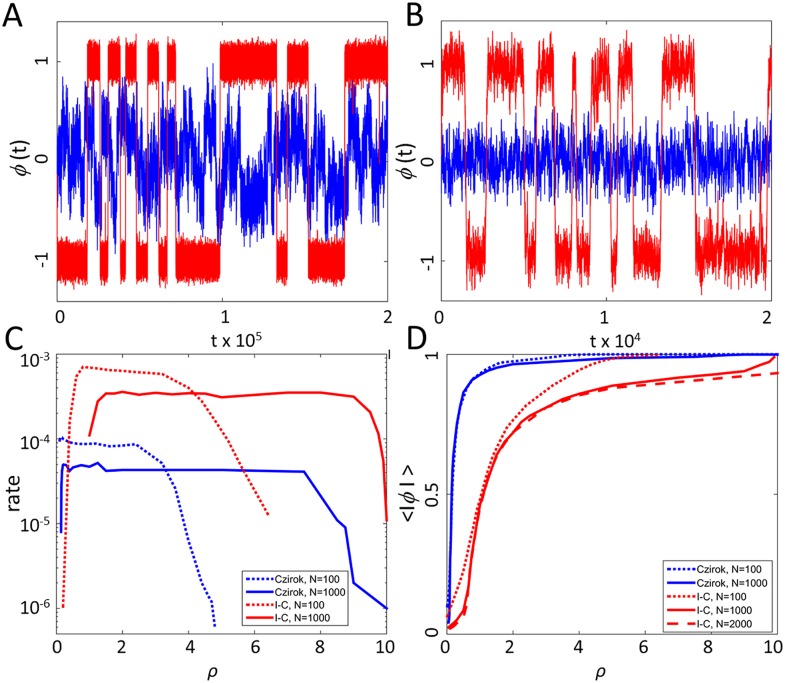
Fig 2.
(A) Sample trajectories for the Czirók model. Blue curve: ρ = 0.1. Red curve: ρ = 3.2. (B) Sample trajectories with individual-choice (I-C) interactions. Blue curve: ρ = 0.2. Red curve: ρ = 3.2. Note that the time scale between two models differs by a factor of ten. (C) Mean transition rates as a function of ρ. (D) The average order parameter as a function of ρ.

