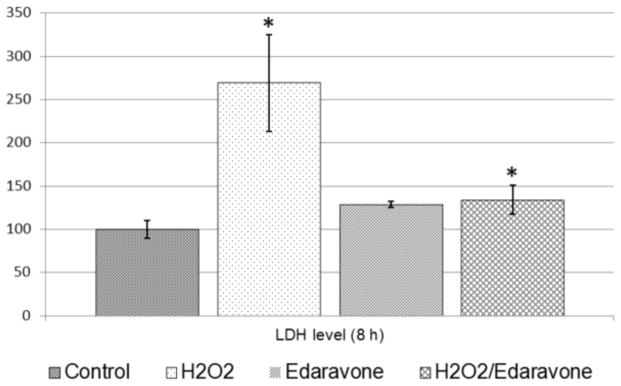
Figure 2. Lactate dehydrogenase (LDH) Cytotoxicity assay.
Cellular damage following each treatment condition was assessed by measurement of LDH released into the medium solution. The average LDH release values obtained from the control condition was set to 100% and the relative LDH release levels for each treatment condition was compared to the control condition. LDH levels released in the culture media significantly increased (p < 0.05) in condition 2 (2.69 fold) and condition 4 (1.34 fold).

