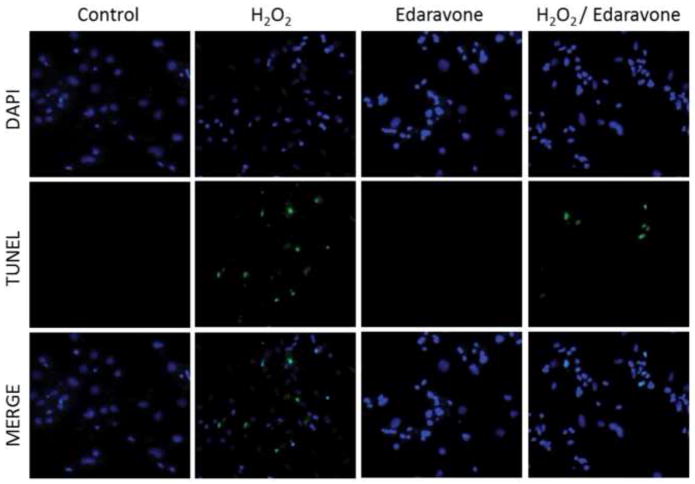
Figure 3. Evaluation of apoptosis using the TUNEL assay.
The different images illustrate representative zones from each condition stained by DAPI, TUNEL. The merged images are also shown. The average percentage of TUNEL positive cells from 10 different zones in each treatment condition was 0.84%, 19.38%, 1.32% and 4.83% in conditions 1, 2, 3 and 4 respectively.

