Fig. 3.

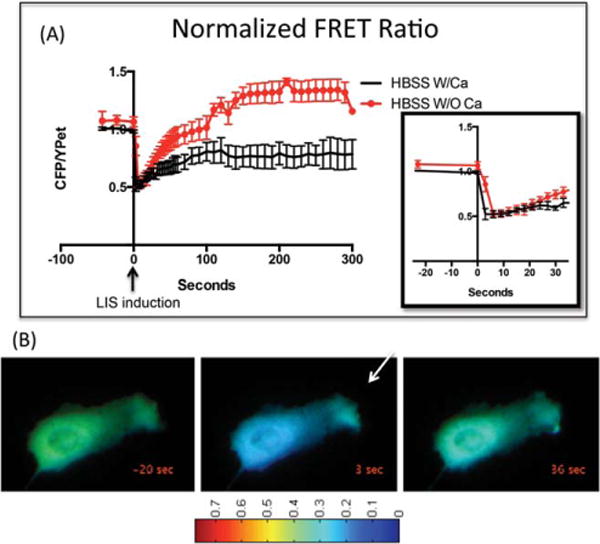
(A) Normalized FRET ratio plotted as CFP/YPet versus time course of cells in HBSS with (black line) or without calcium (red line). Shockwave was induced at 0 seconds. The FRET ratio depicted is the average taken from the center of the cell. The ratio decreases upon cytoplasmic calcium increase. An inset depicts the FRET ratio from 0 seconds to 30 seconds post-shockwave. (B) D3CPV is freely diffusing and therefore the same trends depicted graphically in 3A occur when ratios are measured in other parts of the cell. Ratiometric images show the ratio of 0.35 before (0 seconds), and 0.15 after (3 seconds) shockwave induction. An arrow demonstrates the direction from the shockwave initiation site. Thirty-five seconds post-shock-wave calcium levels are almost the same as preshockwave. This cell has been cropped and magnified to show the respective FRET changes. Thus, laser focus spot point is not shown.
