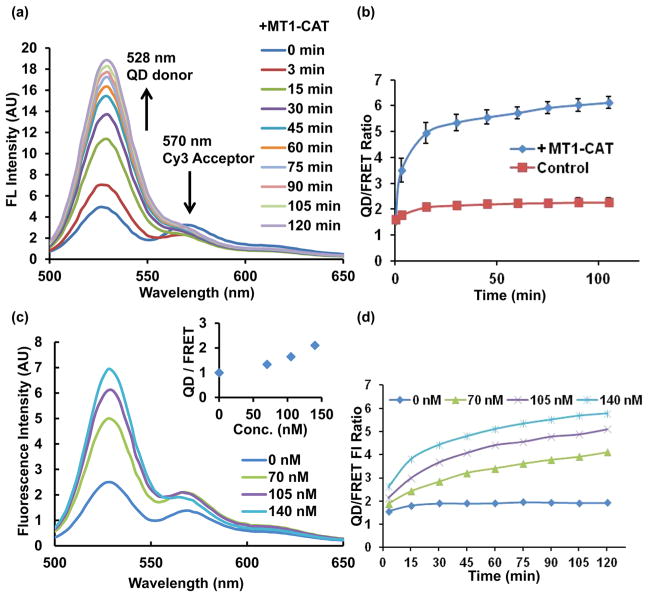
Figure 3.
QD-FRET nanosensor cleavage assay using multiple concentrations of MT1-CAT in vitro. (a) QD signal recovered dramatically after treatment with 140 nM MT1-CAT for up to 120 min. (b) Time courses of donor (QD)/acceptor (Cy3-FRET) emission ratios (n = 3, error bar: SEM). (c) Representative spectra of nanosensors upon cleavage for 15 min at 37 °C with different concentrations of MT1-CAT. (Inset shows the emission ratios of QD/FRET). (d) Time courses of QD/FRET emission ratios of the nanosensor when incubated with different concentrations of MT1-CAT. Excitation was performed at 410 ± 5 nm and emission was collection at 528 ± 5 nm for the QD and 570 ± 5 nm for the FRET signal.

