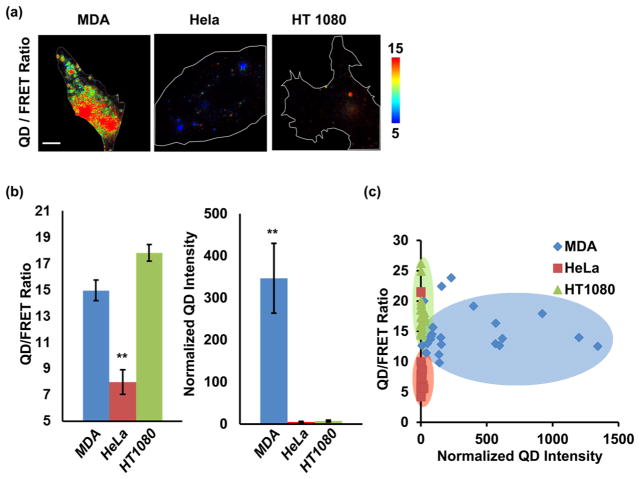
Figure 5.
Different cancer cell lines can be classified by the nanosensor QD/FRET ratio and QD intensity. (a) Representative QD/FRET ratio images of MDA-MB-231 (left), HeLa (middle), and HT1080 (right) cell lines. (b) Comparison of the QD/FRET ratio and QD intensity among MDA-MB-231 (n = 22), HeLa (n = 23), and HT1080 (n = 23). ** indicates statistically significant differences from the other two groups, p < 0.001. Error bar: SEM (c) 2D plots with MDA-MB-231 (blue), HeLa (red), and HT1080 (green) cell lines with the x axis depicting the normalized QD intensity and the y axis depicting the QD/FRET ratio.

