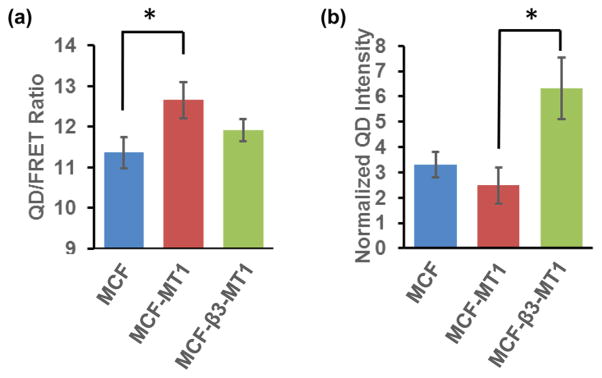
Figure 6.
Multiplex nanosensor readout of QD/FRET ratio and QD intensity depends on MT1-MMP and integrin expression. Comparison of (a) the QD/FRET ratio and (b) QD intensity among the cell lines MCF7 (MCF, blue, n = 29), MCF7 expressing MT1-MMP only (MCF-MT1, red, n = 25), and MCF7 expressing both integrin β3 subunit and MT1-MMP (MCF-β3-MT1, green, n = 35). * indicates statistically significant difference (p < 0.05) by the Bonferroni multiple comparison test.

