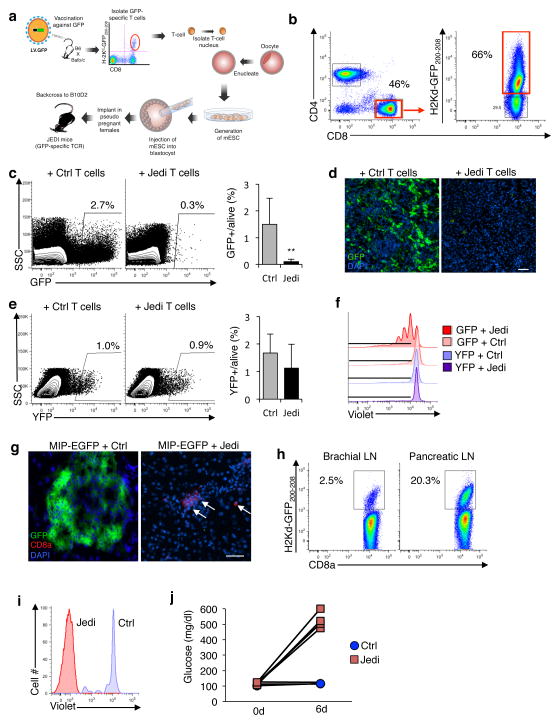
Figure 1. JEDI T-cells specifically kill EGFP-expressing cells and can be used to study pathogen clearance and model autoimmune disease.
(a) Schematic of the methodology used to make the JEDI mice. (b) Splenocytes from JEDI mice were stained with CD3e, CD4, CD8a antibody, and an H-2Kd-GFP200-208 pentamer to measure the frequency of EGFP-specific T-cells. (c) Mice were injected with a lentivirus expressing EGFP (LV.EGFP) and 2 days later JEDI or control (Ctrl) CD8+ T-cells were injected. Flow cytometry was performed to measure EGFP-expressing cells in the spleen after 5 days. Shown is a representative dotplot from two separate experiments. Graph presents mean±s.d. of the percentage of EGFP+ cells among live splenocytes (n= 7 mice/group). **P<0.01 vs Control-treated. (d) Fluorescent microscopy analysis of the spleen of mice described in (c). Representative images are shown. White bar represents 100 μm. (e) Mice were injected with LV expressing EYFP (LV.EYFP) and 2 days later JEDI or control CD8+ T-cells were injected. Flow cytometry was performed to measure EYFP-expressing cells in the spleen after 5 days. Shown is a representative dotplot from two experiments (left). Graph presents the mean±s.d. of EYFP+ cells among live splenocytes (n=3 mice/group). (f) Bone marrow cells were transduced with LV.EYFP or LV.EGFP and differentiated into dendritic cells (BMDCs). Isolated JEDI or B10D2 CD8+ T-cells were stained with Violet Cell Proliferation dye and added to BMDCs. EGFP-specific cells were identified by H-2Kd-GFP200-208 pentamer staining. Representative flow cytometry plots are shown (n=3 wells/group). (g) MIP-EGFP mice were injected with 1×10⁶ JEDI or control CD8+ T-cells, and vaccinated with EGFP. Fluorescent microscopy analysis of the pancreas was performed 6 days after T-cell transfer. Representative images are shown (n=4 mice/group). Arrows point to CD8+ cells in the tissue. White bar represents 100 μm. (h) Flow cytometry of H-2Kd-GFP200-208 pentamer positive CD8+ T-cells in the brachial and pancreatic lymph nodes of MIP-EGFP mice injected with JEDI T-cells as in (g). (i) MIP-EGFP mice were injected with 2×10⁶ Violet Cell Proliferation dye-labeled JEDI or control CD8+ T-cells, and 6 days later proliferation was measured in the CD8+ T-cells in the pancreatic lymph nodes. EGFP-specific T-cells were identified by H-2Kd-GFP200-208 pentamer staining. Representative histogram is shown (n=2 mice/group). (j) Blood glucose measurements at the indicated times of mice described in (g) (n=4 mice/group).

