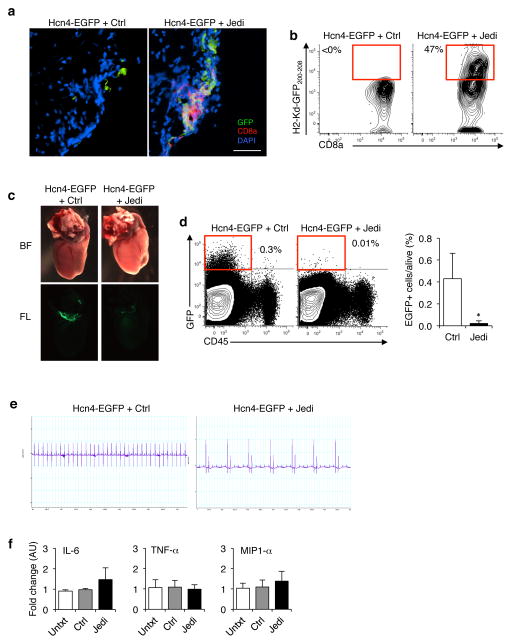
Figure 4. JEDI T-cells can deplete rare cell populations to study their function.
(a) Florescent microscopy images of the heart 5 days after transfer of 5×10⁶ JEDI T-cells and vaccination against EGFP. Sections were stained with CD8a to mark CD8+ T-cells. Representative image is shown (n=3 mice/group). White bar represents 100 μm. (b) Flow cytometry analysis of the heart at 5 days after T-cell transfer to measure the frequency of EGFP-specific T-cells. Cells were stained for CD45, CD8a, CD3e, and H-2Kd-GFP200-208 pentamer. (c) Hcn4-EGFP mice were injected with 5×10⁶ JEDI or control CD8+ T-cells, and vaccinated with EGFP. Low magnification (2x) whole mount bright field (BF) and fluorescent (FL) images of the hearts at 10 days post-transfer. (d) Flow cytometry analysis of the frequency of EGFP+ cells in the heart 10 days after T-cell transfer. Cells were stained with CD45 to mark hematopoietic cells in the heart. Dotplots are representative of 2 experiments. Graph presents the mean±s.d. of the frequency of EGFP expressing cells in the heart (n=4 mice/group). *P<0.05 vs Control-treated. (e) Electrocardiogram (ECG) on the mice treated in (a). Images are representative of 2 experiments (n=4 mice/group). (f) RT-qPCR analysis of inflammatory cytokine mRNA levels in the heart of Hcn4-EGFP mice treated in Fig. 4a. Graphs present mean±s.d. relative to untreated (n=4 mice/group).

