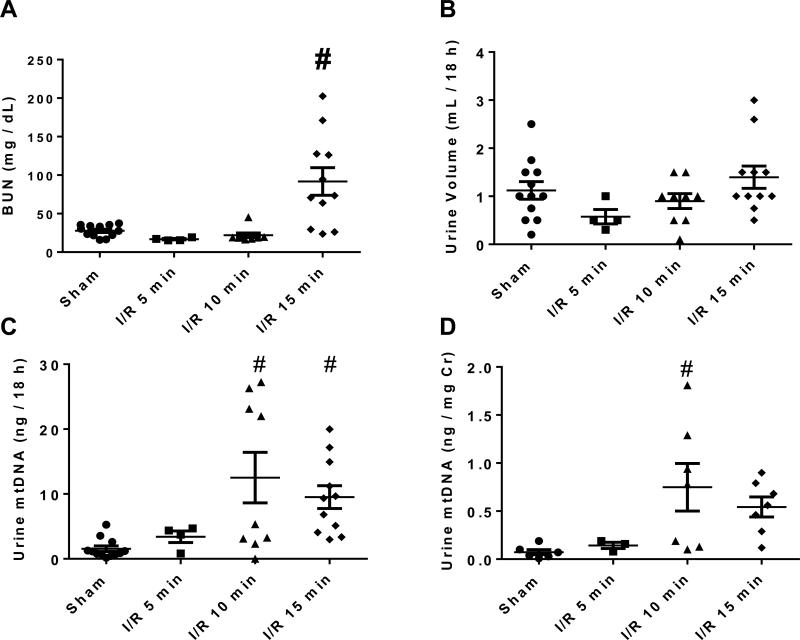
Figure 3. Urinary mtDNA levels are increased in mice following renal I/R.
Male C57BL/6 mice underwent sham surgery or ischemia (5, 10 or 15 min) followed by reperfusion. Mice were placed in metabolic cages from 6-24 h after reperfusion for urine collection. Blood was collected and mice were euthanized 24 h after reperfusion. Renal function was evaluated by BUN (A) and 18 h urine output (B). Urinary mtDNA levels were measured by real time PCR for ND1 and are expressed as total urinary output in 18 h (C) and urinary output corrected for urinary creatinine levels (D). Data are expressed are mean +/− SEM. # indicates statistical significance at p<0.05 vs. sham controls; sham (n=12), 5 min I/R (n=4), 10 min I/R (n=9), 15 min I/R (n=11).

