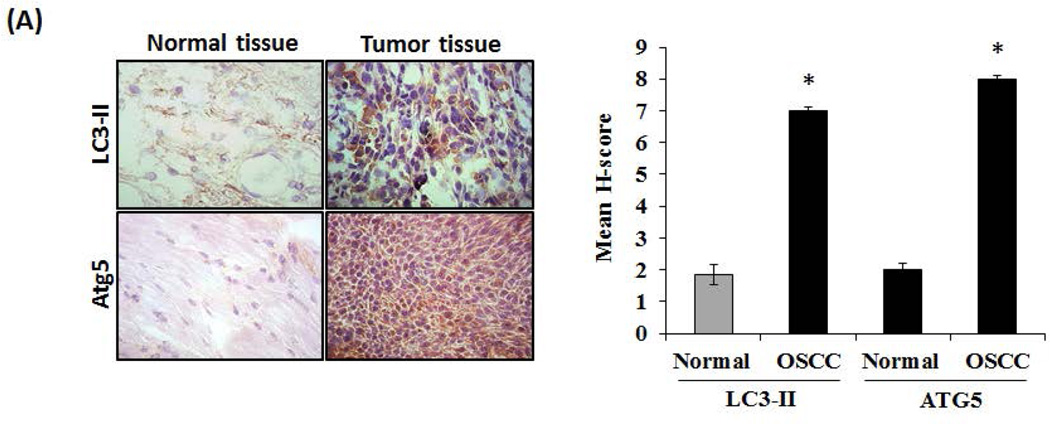
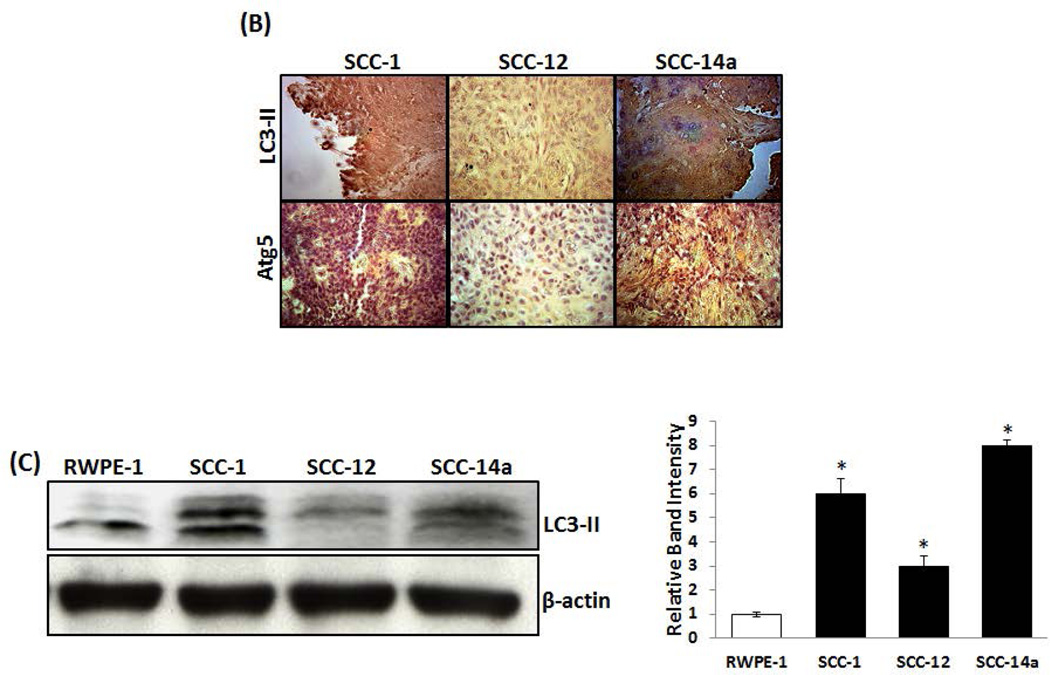
Fig. 1. LC3-II and Atg5 expression in OSCC.
Immunohistochemical staining for LC3-II and Atg5 expression in (A) human primary OSCC tumors specimens compared to normal adjacent tissue, and (B) tumors developed using SCC-1, SCC-12 and SCC-14a cells in an athymic mouse model. The mean H score of OSCC and adjacent normal tissue from 3 specimens respectively is illustrated as a graph. The data are shown as mean ± SD (*p < 0.05). (C) Total cell lysates obtained from SCC-1, SCC-12, SCC-14a and normal epithelial (RWPE-1) cells were analyzed for LC3-II expression by western blot. β-actin expression served as control. Data shown are representative of three replicate studies. The band intensities were quantified by ImageJ program as shown in the right panel. The values are expressed as mean band intensity (LC3-II/β-actin) ± SD of triplicates (*p<0.05).


