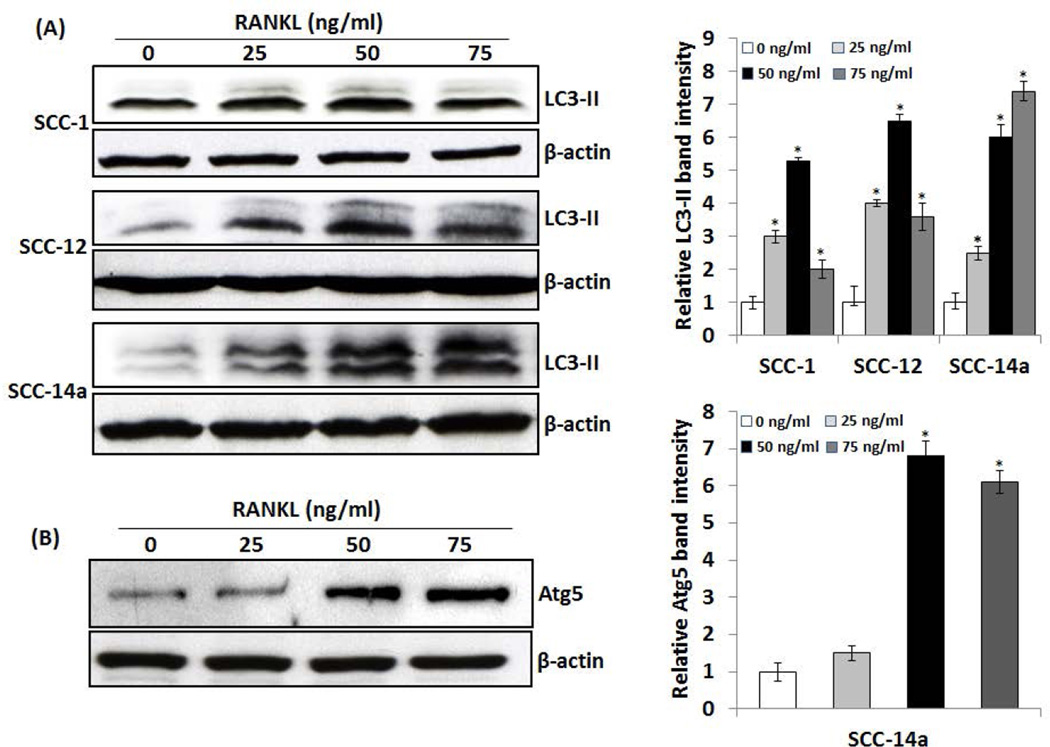
Fig. 3. Western blot analysis of RANKL induction of LC3-II and Atg5 expression in OSCC cells.
(A) SCC-1, SCC-12 and SCC-14a cells were treated with different concentration of RANKL (0–75 ng/ml) for 48 h and total cell lysate obtained from these cells were analyzed by western blot using specific antibodies against LC3-II. (B) Western blot analysis of Atg5 expression in RANKL stimulated SCC14a cells using specific antibodies against Atg5. β-actin expression served as control. The band intensities were quantified by ImageJ program as shown in the right panel. The values are expressed as mean relative band intensity ± SD (*p<0.05).

