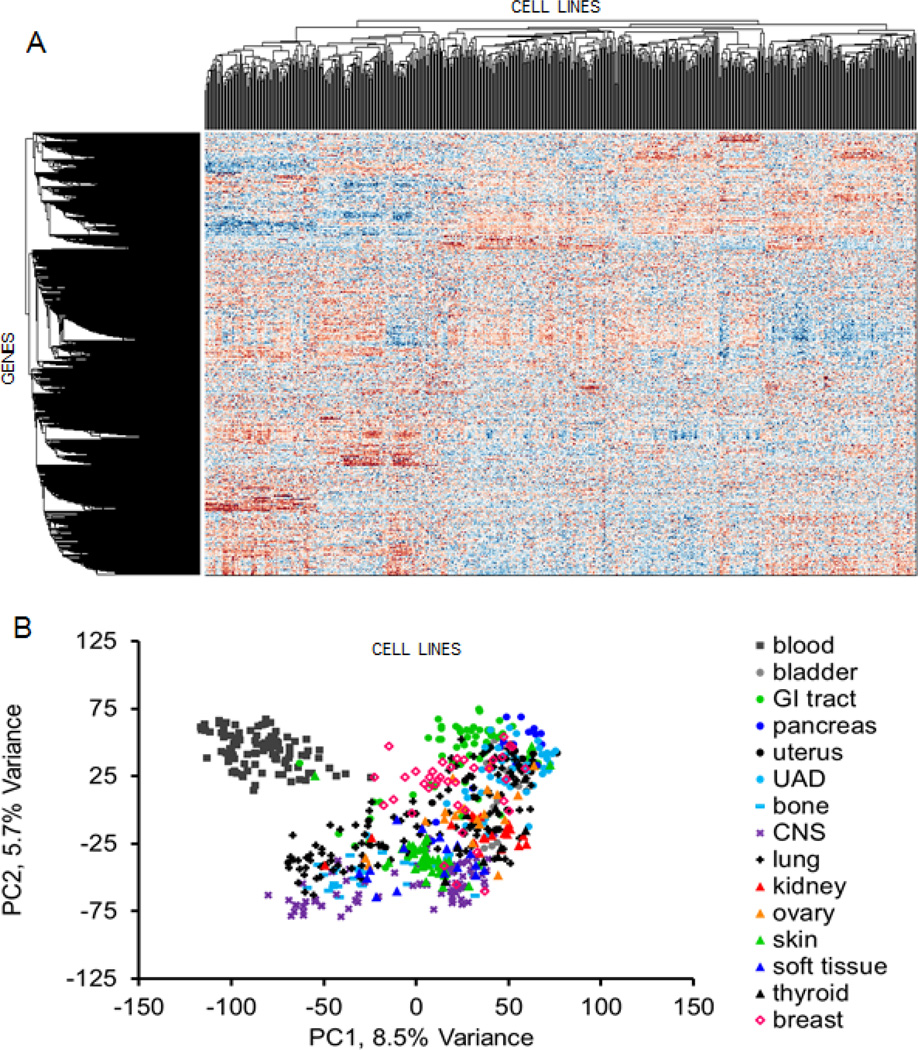
Fig. 4.
The Cancer Genome Project [41] has profiled gene expression of hundreds of cancer cell lines. The data from 650 cell lines was quantile-normalized and log transformed, and then converted to z-scores for each row. (A) Hierarchical clustering applied to this data revealed distinct groups of cell lines and genes. (B) PCA treating the cell lines as entities and the genes the attributes coloring the cell lines by cancer type shows non-random ordering.

