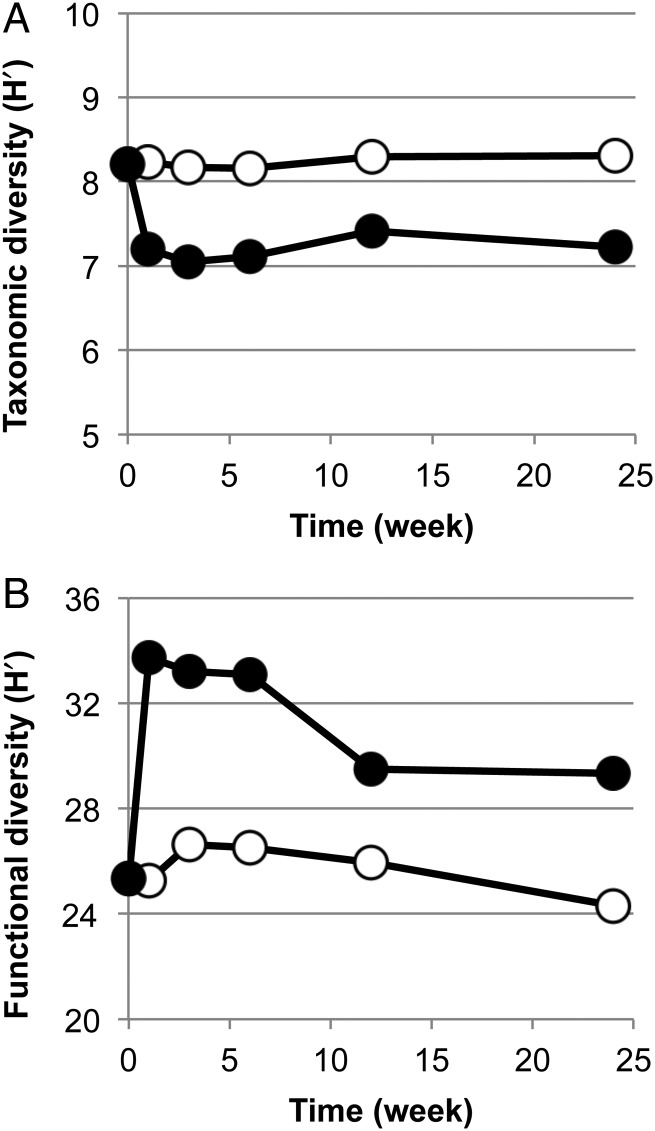
Figure 3.
Time-course changes in taxonomic and functional diversity of metagenomes in control and polluted soils. (A) Taxonomic diversity. (B) Functional diversity. Open and closed circles: control and polluted soils, respectively. The Shannon-Wiener indices (H′) for taxonomic and functional diversities of the metagenomic samples were calculated from the compositions of 97% OTUs of the 16S rRNA gene amplicons and the compositions of genes for KO-assigned proteins, respectively.

