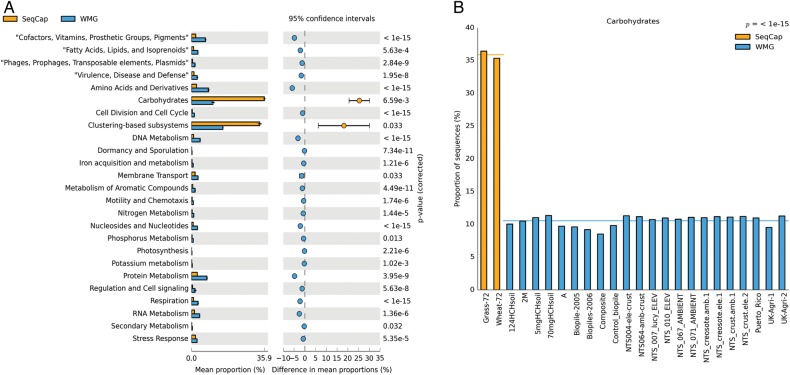
Figure 6.
(A) The mean proportions of the significantly different subsystems (Level 1) in the captured metagenomes (SeqCap) from the 22 whole metagenomes from the MG-RAST database (WMG) with their respective 95% CI and corrected P-values. (B) The proportion of carbohydrate subsystem in the captured metagenomes (SeqCap) compared with 22 whole metagenomes (WMG). This figure is available in black and white in print and in colour at DNA Research online.

