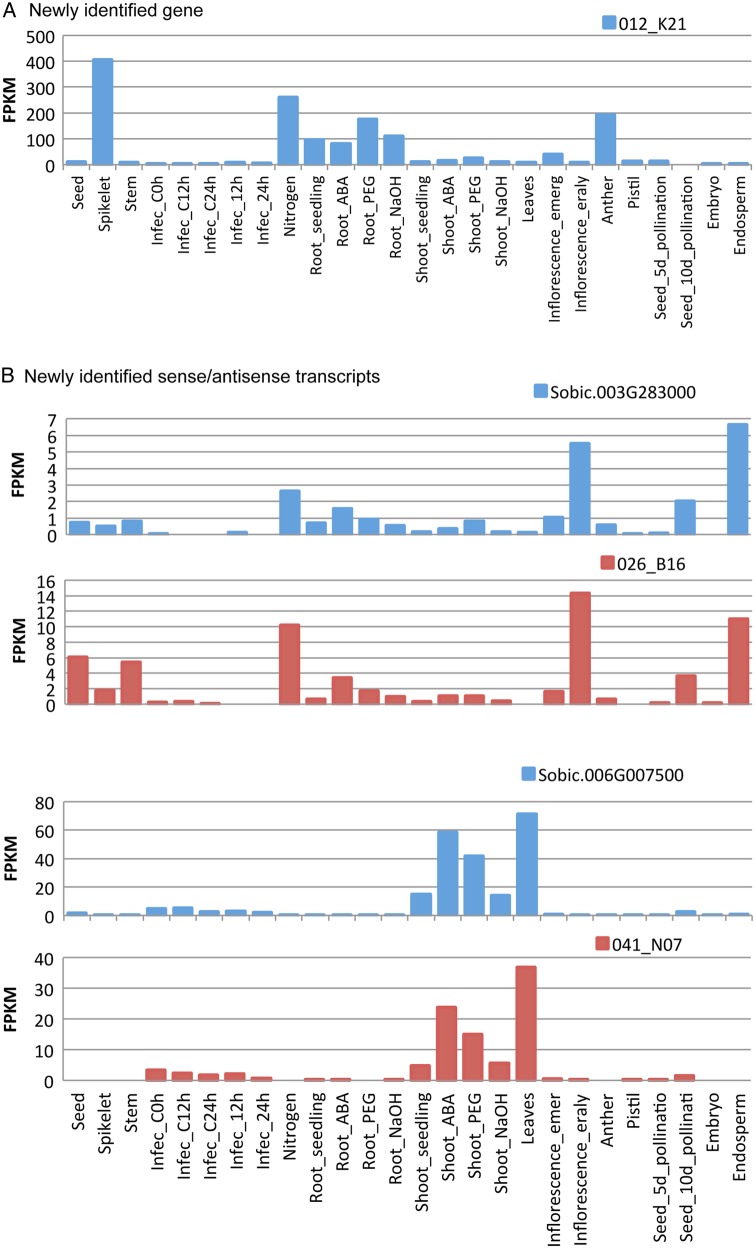
Figure 4.
Examples of expression of newly identified gene and sense–antisense transcripts. The plot shows the relative expression (FPKM) of a newly identified gene (A), and sense and antisense transcripts (B) in seed, spikelet and stem from our RNA-Seq data, as well as the publicly available sorghum RNA-Seq data of stressed, infected and tissue-specific samples.13,15–17 Blue lines show sense transcripts and red lines show antisense transcripts. This figure is available in black and white in print and in colour at DNA Research online.

