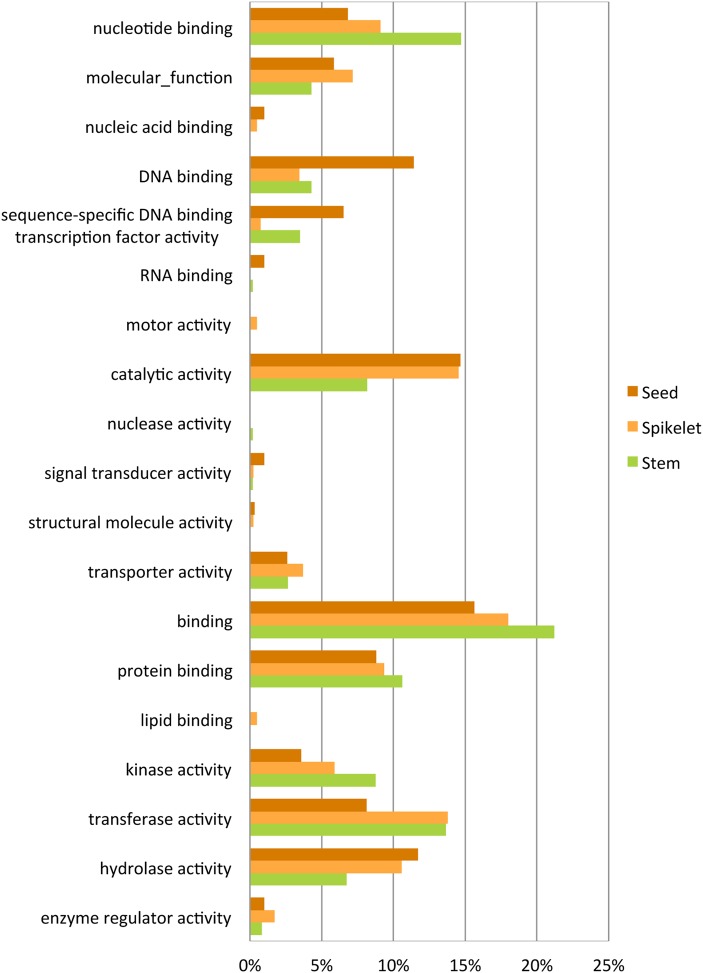
Figure 5.
Functional classification based on the GO slim categories of tissue-specific genes. The histogram shows the distribution of genes classified into GO slim categories of specifically expressed genes in each tissue type. Functional annotations are presented in relation to the molecular function.

