
Fig. 7.
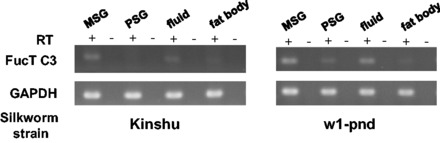
Gene expression pattern of the Fuc-T C3. RT-PCR of Fuc-T C3 gene was performed. MSG shows middle silk gland, and PSG shows posterior silk gland. GAPDH was used as internal controls.
Official websites use .gov
A
.gov website belongs to an official
government organization in the United States.
Secure .gov websites use HTTPS
A lock (
) or https:// means you've safely
connected to the .gov website. Share sensitive
information only on official, secure websites.
Gene expression pattern of the Fuc-T C3. RT-PCR of Fuc-T C3 gene was performed. MSG shows middle silk gland, and PSG shows posterior silk gland. GAPDH was used as internal controls.