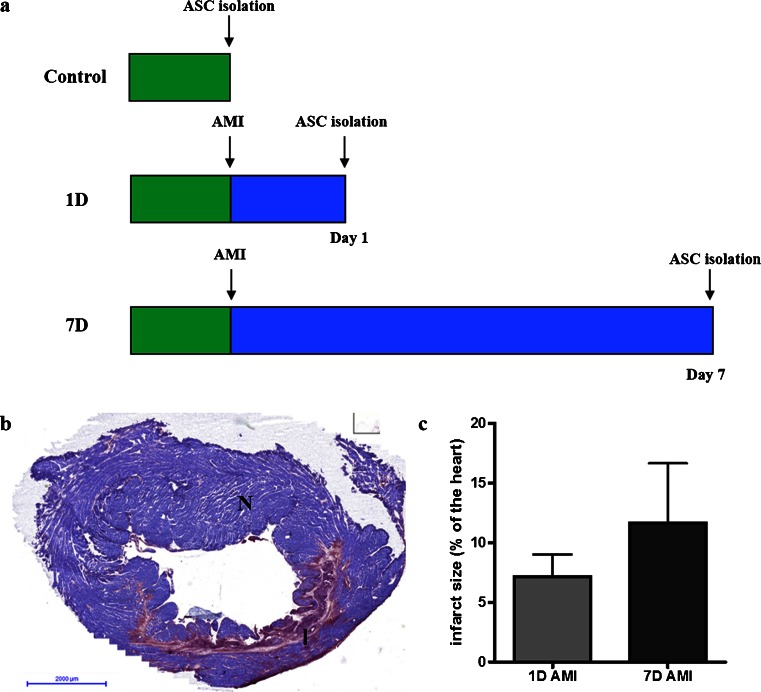
Fig. 1.
Experimental set-up and AMI. a Experimental set-up for the three different groups: Control, 1D and 7D. b Representative microscopical image of a PTAH staining to confirm infarction. PTAH stains viable cardiomyocytes purple (N for normal tissue), and damaged cells red/pink (I for infarcted tissue). c Infarct size as percentage of a heart slide. Infarct size of the 1D group was 7.2 ± 2.8 % and 11.7 ± 5.7 % in the 7D group. Data shown as mean ± SD (7D group n = 6, 1D group n = 5)

