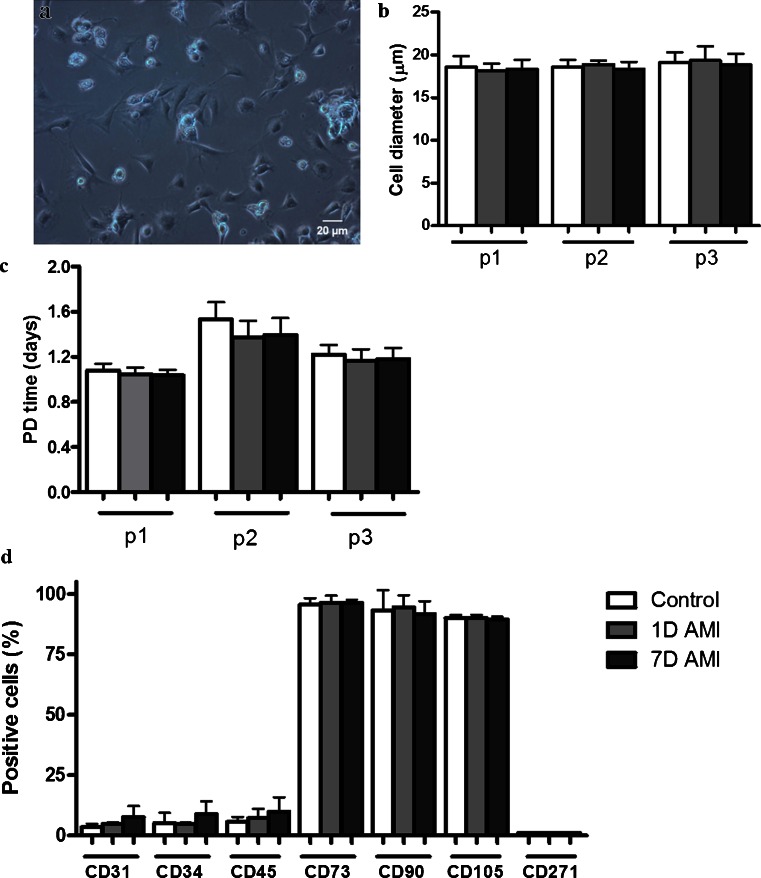
Fig. 3.
Effect of AMI on cultured rat ASC. a Representative light microscopy image demonstrating the morphology of cultured rat ASC. b Cell size (μm) of ASC, demonstrating no significant differences between the three groups. c Population doubling time (in days) depicted for passages 1–3, showing no significant differences between the three groups. d Percentage of positive cells for the markers CD31, CD34, CD45, CD73, CD90, CD105 and CD271, showing no significant differences in numbers of positive cells between the groups. Data shown as mean ± SD (Control and 7D group n = 6, 1D group n = 5)

