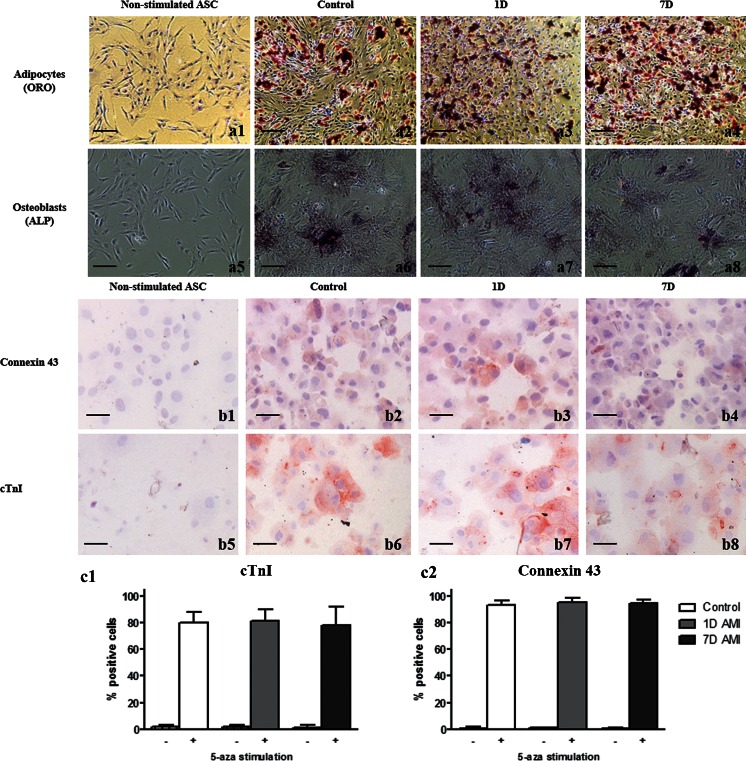
Fig. 4.
Multilineage differentation of rat ASC. (a) Representative images showing differentiation of ASC towards osteoblasts, shown by ALP staining, and adipocytes, shown by Oil Red O staining (a1-a4). No staining is found in the non-stimulated cells (a5-a8). (b) Representative images of differentiation towards cardiomyocytes, staining for connexin 43 (upper panel, b1-b4) and cTnI (lower panel, b5-b8) on cytospin slides. (c) Bar graph showing quantification of the number of positive ASC for cTnI (c1) and connexin 43 (c2) without (−) or stimulated (+) with 5-aza-2-deoxycytidin. No significant differences in differentiation between the three groups were found. Data shown as mean ± SD (Control and 7D group n = 6, 1D group n = 5)

