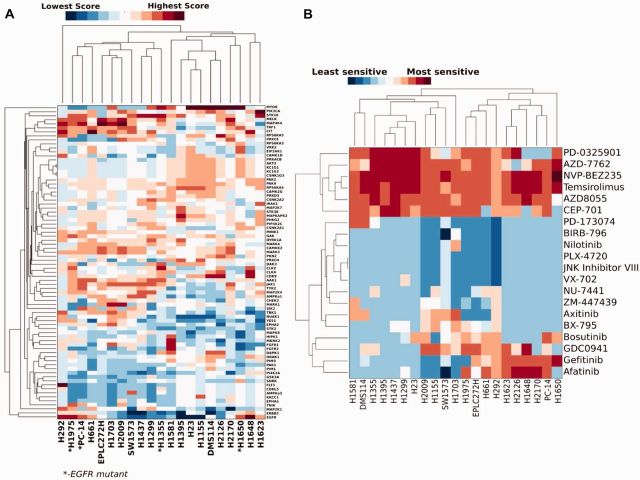
Fig. 2.
KAR identifies relationships in kinase dependence among lung cancer cell lines. (A) Hierarchical clustering of scaled KAR scores for 21 lung cancer cell lines, showing relationships among cell lines and kinases. (B) Hierarchical clustering of drug IC50 data for the 20 overlapping drugs in each cell line’s dataset. Each column was normalized before clustering to give a mean of 0 and a standard deviation of 1. Red indicates that a cell line has higher sensitivity to a given kinase/drug and blue indicates relatively lower sensitivity. Clustering results differ when clustering based on kinase score vs. drug IC50

