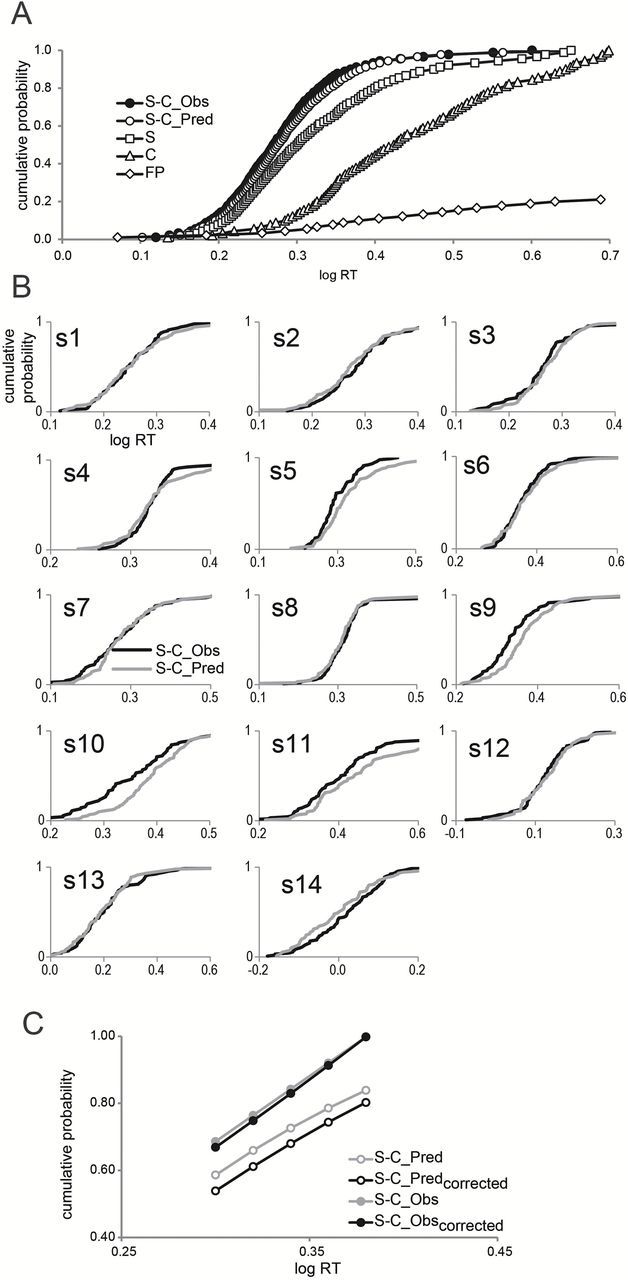
Figure 2.

CDFs for subjects, in the study by Veldhuizen et al. (2010), who responded to sucrose, citral, and the congruent mixture of sucrose + citral. (A) The pooled CDF obtained for the sucrose–citral mixture (S-C_Obs, filled circles); the CDF to the mixture predicted from a model of stochastic independence (probability summation model: S-C_Pred, open circles); the CDF for sucrose (S, open squares); the CDF for citral (C, open triangles); and the CDF for false positive responses to water (FP open diamonds). (B) CDFs to the sucrose–citral mixture for each of the 14 individuals subjects. Black and gray lines represent observed and predicted CDFs, respectively. (C) Predicted (open circles) and observed (filled circles) CDFs over a linear portion of the pooled distribution of RTs to the mixture, before correcting (gray) and after correcting (black) for false positive responding. Values on the abscissa are given as log RT (seconds).
