Figure 2.
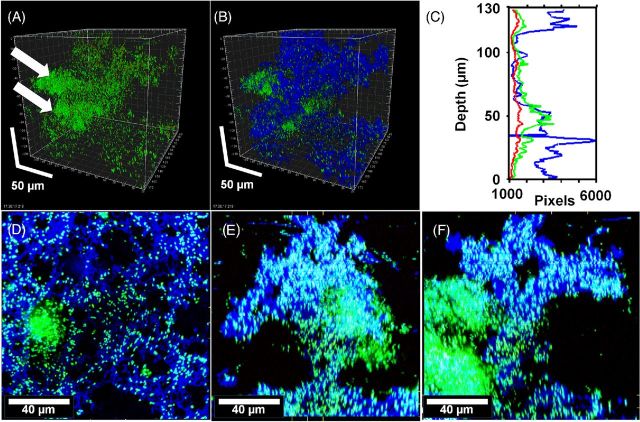
Pseudomonas aeruginosa PittD biofilm showing cells stained with Molecular Probes Live (green)/Dead (red) BacLight LIVE/DEAD Kit and reflected signal from the EPS stained with KMnO4 contrast enhancer (blue). (A) Signal from green and red channels showing a conventional LIVE/DEAD view of the biofilm, eDNA staining is indicated by the white arrows. (B) Same image as ‘A’ with blue reflected signal from KMnO4 revealed large amounts of EPS between individual cells. Scale = 50 μm. (C) The biomass distribution depth profile showing the vertical distribution of live (green), dead (red) and EPS (blue) signal. (D) XY plan view of the base of the biofilm revealed a network of EPS connecting individual bacteria. (E) and (F) XZ and XY side views, respectively, with the base of the biofilm at the bottom showing the EPS forming convoluted structures growing into the overlying liquid medium. There was a dense cluster of cells (shown by arrows in panel (A) and to the left in panel (E) that did not stain with KMnO4 but appeared to contain eDNA (diffuse green). Panels (E), (F) and (G): scale = 40 μm, sections are projections of 10 μm thick.

