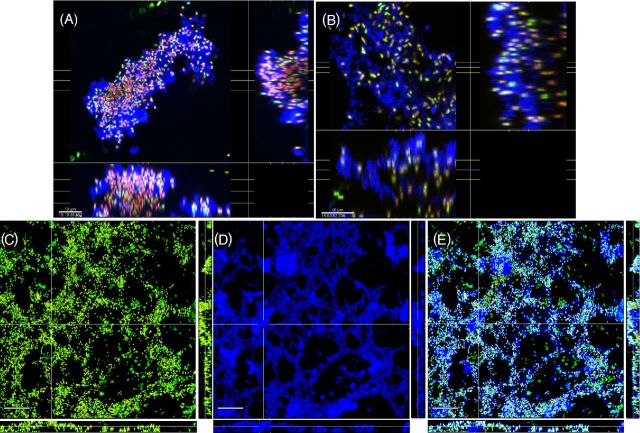
Figure 4.
Pseudomonas aeruginosa PAO1 biofilms showing cells stained with Molecular Probes Live (green) /Dead (red) BacLight Kit and reflected signal from the EPS stained with KMnO4 contrast enhancer (blue). (A) and (B) plan (XY) and side (XZ and YZ) views of two different biofilms showing EPS connecting cells and extending into the liquid growth medium. Scale = 10 μm. Web-like structures at the base of the biofilms were also observed in the PAO1 biofilms (D–F). (D) ‘Conventional’ Live / dead image without KMnO4, (E) reflected signal from KMnO4 staining, (F) combined image showed that cells were connected along webs of EPS. Panels show square XY plan view, and XZ and YZ side views below and to the right of the plan view. Scale = 30 μm.

