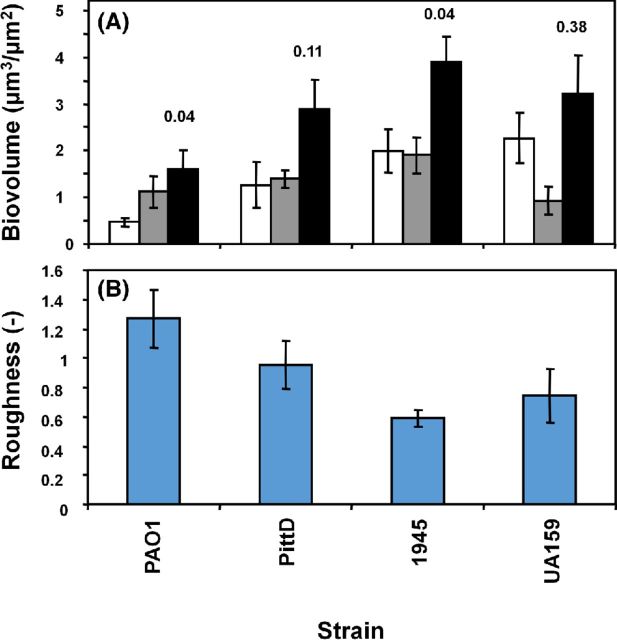
Figure 6.
COMSTAT analysis of the various biofilms. (A) Volume of cells (white bars), EPS (grey bars) and cells + EPS (black bars), mean ±1 SE. Pixels colocalizing with the bacteria and the reflected signal were subtracted out. P values for the volume estimated from cells alone compared to cells and EPS are given above the black bars. (B) Biofilm roughness. Data represents mean and 1 S.E. from 4, 5 or 6 independent replicates.

