
Figure 3.
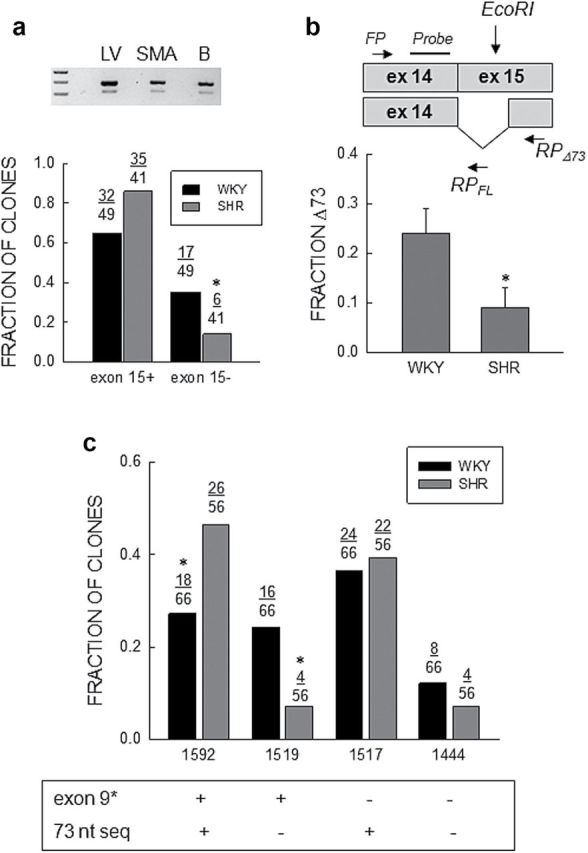
Abundance of Cav1.2Δ73 transcripts. (a) Fraction of clones. Top: EtBr stained gel of PCR products for Cav1.2 spanning exon15 from left ventricle, SMA, and brain. (b) Bottom: Fraction of full length (exon15+) or truncated (exon15−) clones relative to the total number in WKY (n = 49) and SHR (n = 41) SMA analyzed by sequencing. The star (*) indicates a statistically significant difference between WKY and SHR (Fisher exact test; P = 0.05). (b) Quantitative PCR. Top: Schematic representation of the location of the forward (FP) and reverse (RP) qPCR primers, and the probe for the 73 nucleotide (nt) deletion (Δ73) in exon15 plus full length transcripts with the location of the EcoRI site in exon15. Bottom: Analysis of abundance of the 73 nt deletion shown as the ratio of deleted to total Cav1.2 transcripts (Δ73/(Δ73 + FL)). Bars and vertical lines represent the mean and 1 SEM (n = 7), respectively, and star (*) indicates values statistically different from unity (unpaired t-test; P < 0.05). (c) Combinatorial analysis of expression of exons9* and exon15Δ73. The fraction of clones with and/or without exon9* and/or exon15Δ73 are shown for WKY and SHR. The “FL or +” indicate full length clones and the “−” clones with the 73 nt deletion. The star (*) indicates statistically significant difference between WKY and SHR (χ2-test; P = 0.03 for 1592 and P = 0.01 for 1519).