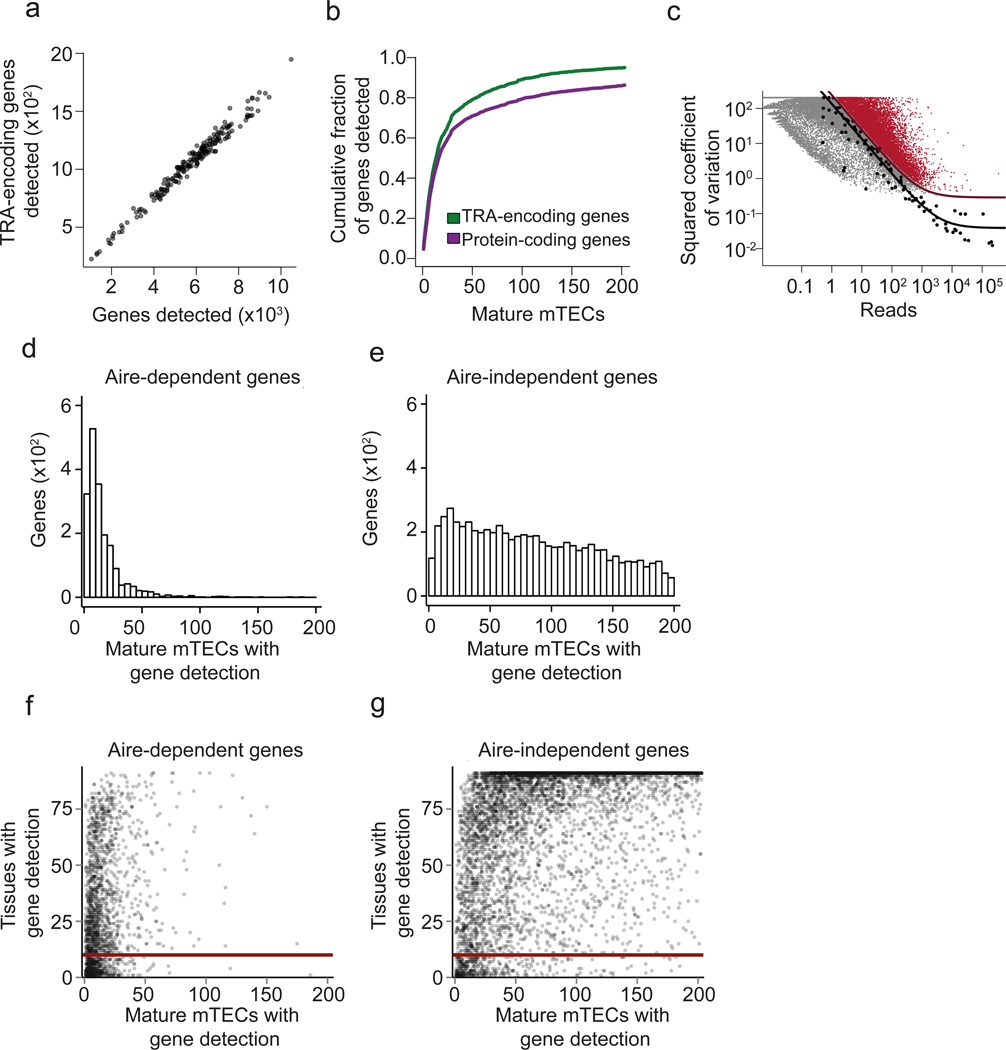
Figure 1.
Mature mTECs are heterogeneous at the single-cell level but express a comprehensive set of TRAs as a population. (a) Scatterplot of scRNA-seq assay showing the number of detected TRA genes versus the number of total genes detected in single mature mTECs (n=203) isolated from pooled thymic tissue of 4-6 weeks old C57BL/6 wild type mice. Semitransparent coloring has been used to ameliorate over-plotting. (b) Cumulative fraction of detected TRA-encoding genes (green line) and all protein coding genes (purple line) with increasing number of mTEC transcriptomes (n=203). (c) Identification of 9,689 significantly highly variable genes across single mature mTECs (n=203) using a published method.25. Genes with a biological squared coefficient of variation (SCV) of more than 0.25 at 10% FDR were classified as highly variable (colored in red). Black points represent ERCC RNA spike-ins, the solid black line shows the model fit for the technical noise, and the purple line depicts the threshold of 0.25 biological SCV (i.e. 50% CV). (d) Histogram showing the number of Aire-dependent genes (y-axis) as a function of the number of mature mTECs (n=203) for which the gene was detected (x-axis). (e) Same plot as in Fig. 1d, but showing the data for Aire-independent genes. (f) Scatterplot of the number of tissues in which individual genes are detected in the FANTOM dataset26 (y-axis) plotted as a function of the number of mature mTECs (n=203) in which the gene was detected. Each data point represents one Aire-dependent gene. The solid red line shows the value of 10 on the y-axis (i.e. threshold on the number of tissues described in the main text). (g) Same plot as in Fig. 1f, but showing the data for Aire-independent genes.

