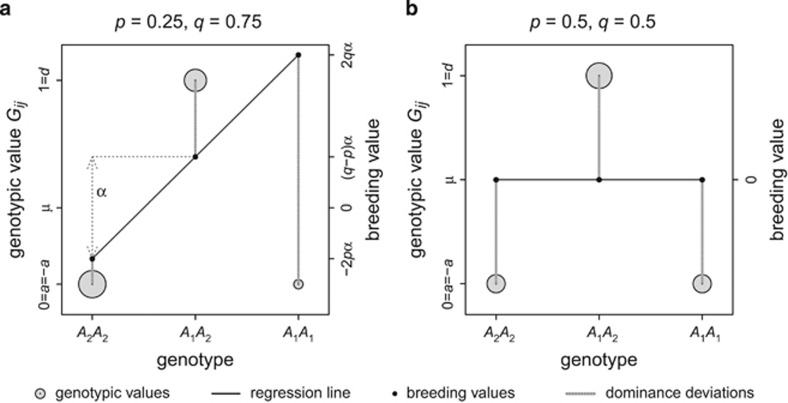
Figure 2.
Derivation of additive and dominance genetic variance of heterozygosity for one locus with two alleles with frequencies p and q (see text for details). Genotypic values Gij of 1 are assigned to heterozygotes and 0 to homozygotes, and thus the mean genotypic value μ of the population equals 2pq. Gray circles represent genotypic values and their surface area represents genotype frequencies. Predicted values of a least-squares regression (black line) weighted by genotype frequencies of Gij on the number of A1 alleles represent breeding values (black dots) and the slope of this regression represents the average effect of allelic substitution α. Variance in breeding values represents the additive genetic variance. Dominance deviations (gray vertical lines) are differences between breeding values and genotypic values Gij, and their variance represents dominance genetic variance. Panel a shows an example of unequal allele frequencies, in which case there exists additive genetic variance in heterozygosity, causing heritability of heterozygosity. Panel b shows the case of equal allele frequencies, leading to no additive genetic variance, but considerable dominance genetic variance.

