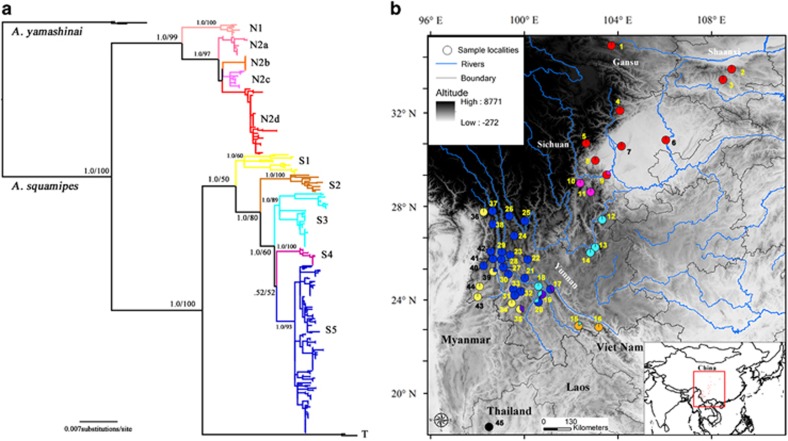
Figure 1.
Phylogenetic tree of A. squamipes (a) and sample localities of A. squamipes (b). The Bayesian tree and the ML tree topologies are very similar, thus only the Bayesian tree is represented. Branch numbers represent PPs/bootstrap values. In the distribution map, numbers are corresponding to those in the Supplementary Table S1 and presented as pie charts. Slice size is proportional to the frequency of the subclades occurring in the site.

