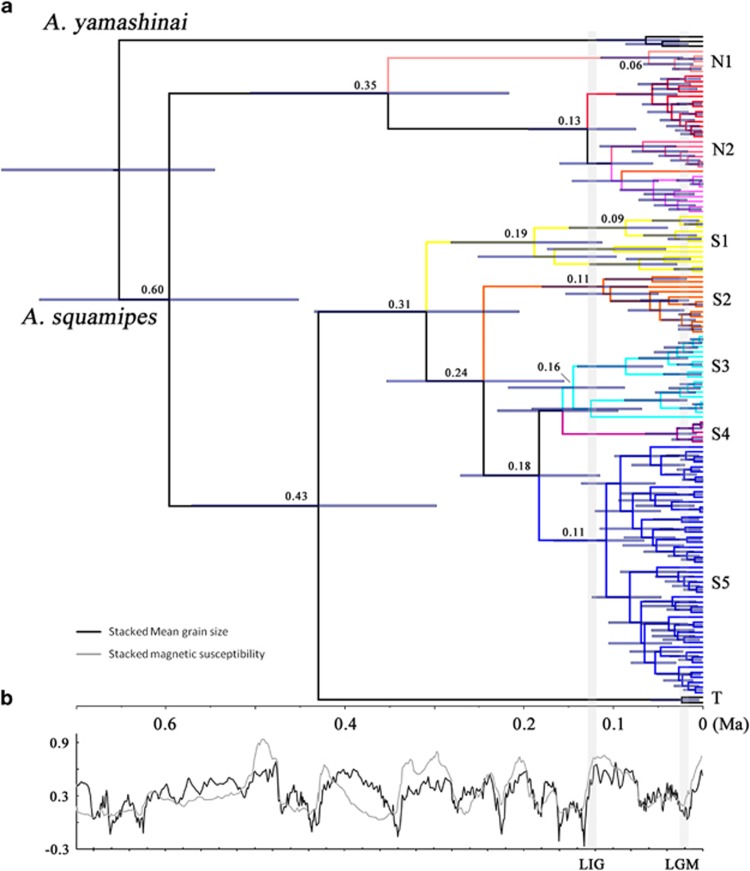
Figure 2.
Divergence time was estimated using BEAST and a relaxed molecular clock (a), and China Loess Plateau grain size and magnetic susceptibility variations through time (b) (Sun et al., 2006). (a) Branch lengths represent time. Node numbers represent median ages. Node bars indicate the 95% CI for the node age. (b) The grain size and magnetic susceptibility values were standardized. High values correspond to interglacial periods and low values correspond to glacial periods.

