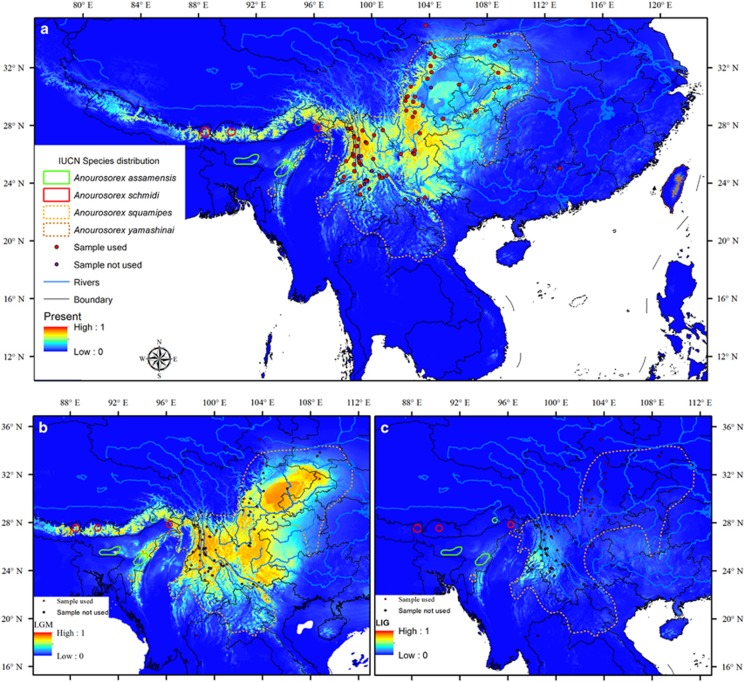
Figure 3.
Ecological niche model projections of (a) the current distributions of A. squamipes, (b) the distribution during the LGM and (c) the distribution during the Last Interglacial Maximum (LIG). Sample locations are shown. Locations in red color were used for SDM and locations in violet were not used. A full color version of this figure is available at the Heredity journal online.

