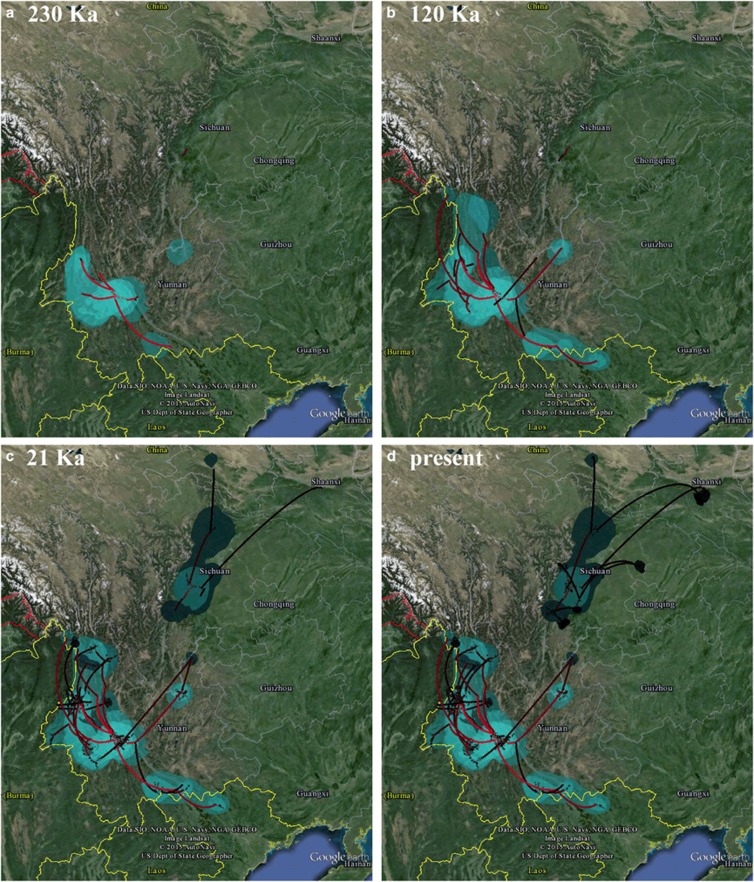
Figure 4.
The reconstructed spatiotemporal diffusion of A. squamipes, shown at 230 ka (a), 120 ka (b), 21 ka (c) and the present day (d). Lines show spatial projections of representative phylogenies of the clades N and S. Colored clouds represent statistical uncertainty in the estimated locations (95% CI). A full color version of this figure is available at the Heredity journal online.

