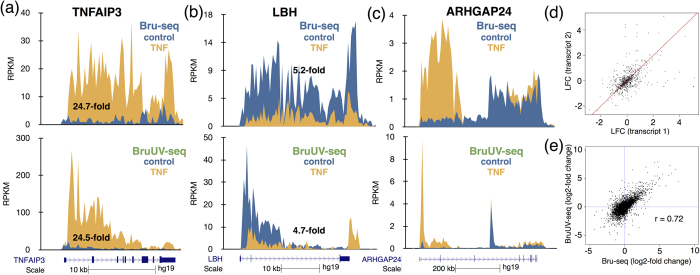
Figure 3. BruUV-seq can be used to predict Bru-seq data for gene induction.
(a) Top: The TNFAIP3 gene is induced 24.7-fold following treatment with TNF in HF1 cells as measured with Bru-seq17. Bottom: Comparing the read density over the first 5 kb of the TNFAIP3 gene of control and TNF-treated cells, we found that BruUV-seq (20 J/m2 UVC) data yield a 24.5-fold enrichment by TNF, which is similar to the 24.7-fold induction measured with Bru-seq at top. (b) Top: Transcription from the LBH gene is reduced 5.2-fold measured with Bru-seq and 4.7-fold measured over the first 5 kb using BruUV-seq at bottom. (c) Isoform-specific induction of the ARHGAP24 gene shown with Bru-seq data on top is confirmed with BruUV-seq at bottom. (d) Pairwise comparison of the TNF-induced log-fold change in gene expression of transcripts in genes with multiple active TSS. Points distant from the identity line (red line) indicate genes with TSS-specific response to TNF. (e) Correlation between TNF-induced changes in gene expression using the full gene lengths in Bru-seq (x-axis) and the first 5 kb of the genes in BruUV-seq (y-axis). The Pearson’s r = 0.72.

