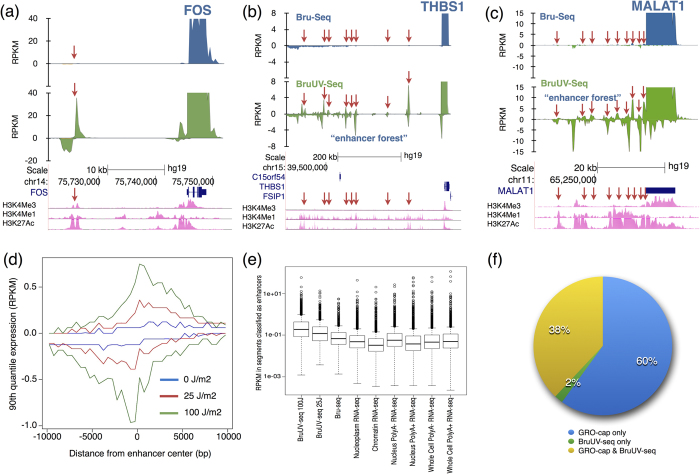
Figure 4. Use of BruUV-seq to identify active enhancer elements genome-wide.
(a) Bru-seq (blue) and BruUV-seq (20 J/m2 UVC) (green) data for the FOS gene and upstream enhancer element (red arrow) in HF1 cells. Bru-seq and BruUV-seq data for an “enhancer forest” region (red arrows) upstream of the highly expressed THBS1 (b) and MALAT1 (c) genes in HF1 cells. (d) An aggregate view of the reads surrounding 526 intergenic enhancer regions as defined by the ENCODE project’s combined genome segmentation annotation in K562 cells. It can be seen that the aggregate signal of eRNA was bidirectional and the enhancement of reads was proportional to the UV dose. (e) Boxplot indicating distribution of expression values (RPKM) observed in intergenic ENCODE-defined enhancer regions in K562 cells. Data includes BruUV-seq, Bru-seq and ENCODE’s cellular fractionation long RNA-seq samples. (f) Comparison of intergenic BruUV-seq (100 J/m2 UVC) and GRO-cap peaks overlapping ENCODE enhancers. GRO-cap data was from GEO (GSE60456)18.

