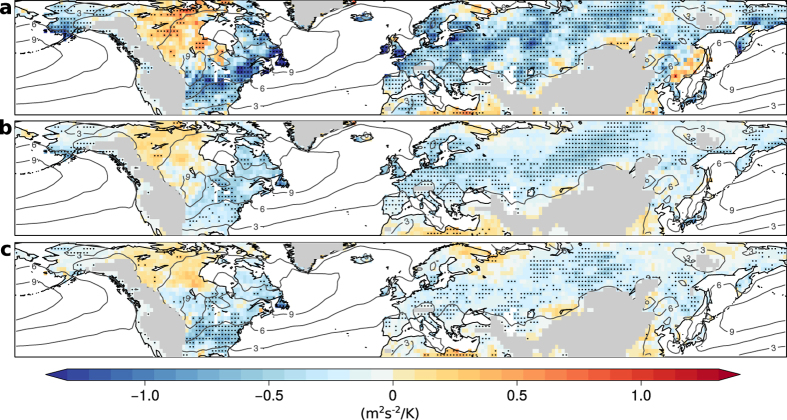
Figure 1. Slope of quantile regressions between anomalies of EKE and temperature in summer.
Regression slopes are shown for the 90th-percentile (a), 50th-percentile (b), and 10th-percentile (c) with the middle panel being similar to Fig. 4 from Coumou et al.31. Stippling indicates significance at the 5%-level and grey contour lines denote EKE climatology in summer. Land regions higher than 1 km have been masked. All maps are created using the open source software R.

