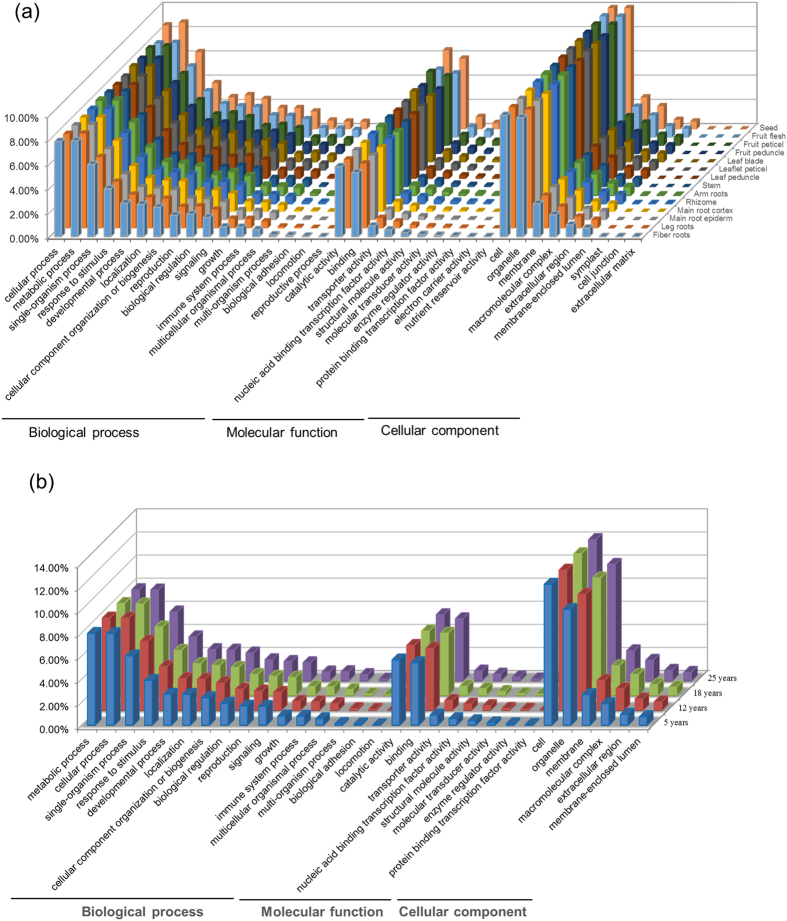
Figure 1. GO term categorization and comparison of genes expressed in (a) whole plant or different tissues and (b) different year-old roots.
The number of gene GO terms categorized into each functional subcategories is present in the percentage of GO terms for that subcategory out of the total GO terms that the unigenes assigned to for whole plant (14 tissues) or each tissue, or different year-old roots (z-axis).

