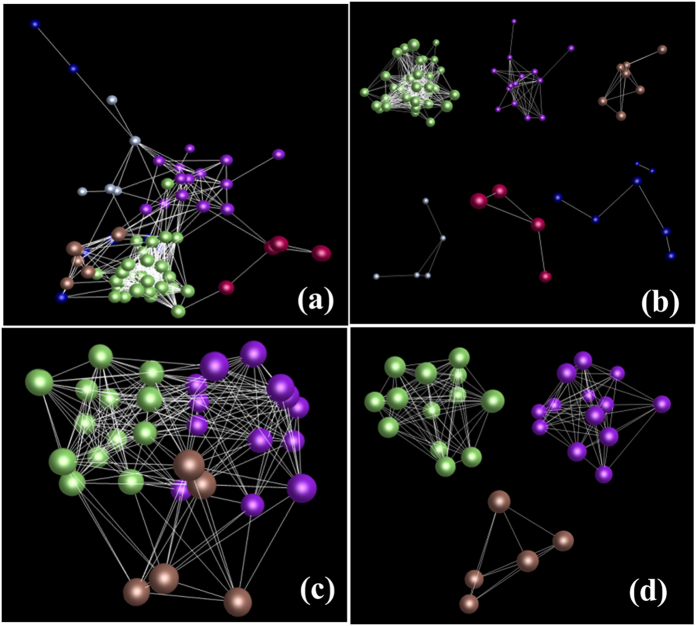
Figure 7. Network of genes likely involved in ginsenoside biosynthesis.
(a) Co-expression network constructed from 78 genes likely involved in ginsenoside biosynthesis in different tissues at a cutoff of P ≤ 0.05, nodes = 74, edges = 565, clusters = 6. Different colors indicate different clusters that have closer interactions (also see Fig. 7b). (b) Different interaction clusters of the genes of the network. (c) Co-expression network constructed from 31 genes likely involved in ginsenoside biosynthesis in different year-old roots at a cutoff of P ≤ 0.05, nodes = 31, edges = 227, clusters = 3. Different colors indicate different clusters that have closer interactions (also see Fig. 7d). (d) Different interaction clusters of the genes of the network. For detail of the clusters, see Table S5.

