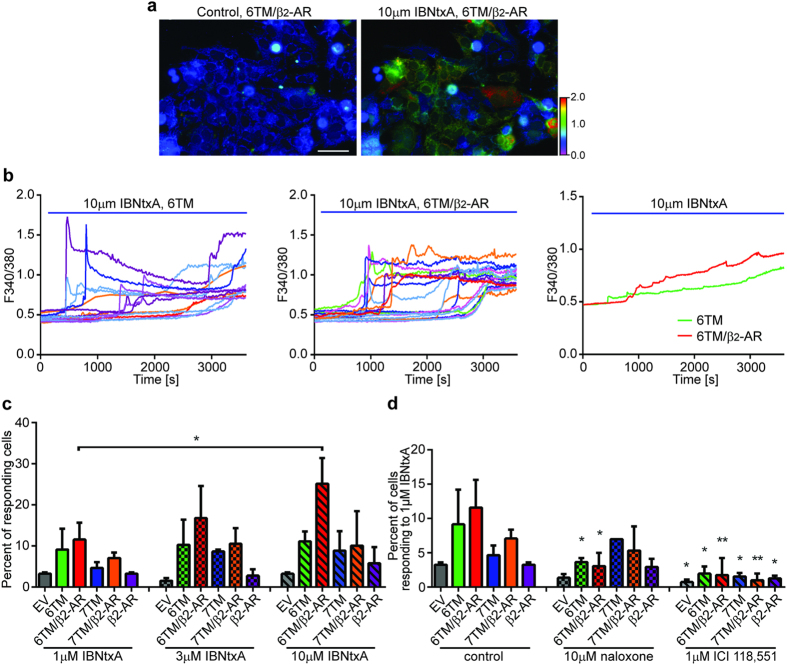
Figure 2. β2-AR contributes to the 6TM-dependent Ca2+ response upon treatment by 6TM-MOR ligand IBNtxA.
(a) Representative images of BE(2)-C cells co-transfected with 6TM and β2-AR before (left; perfused with PBS) and after IBNtxA treatment (right; perfused with 10 μM IBNtxA). A range of the Ca2+ responses were imaged using Fura-2 ratiometric dye. Color scale from green to red shows the F340/380 ratio increase. Scale bar: 100 μm. (b) Ca2+ responses of individual cells, presented as increases in F340/380 for cells transfected with 6TM-MOR (left) or 6TM-MOR/β2-AR (middle). 10 μM IBNtxA was perfused between 60–3600 sec (blue bar). Averaged tracings of Ca2+ -responding cells are shown on right. (c) The percentage of Ca2+ -responding cells upon increasing concentrations of IBNtxA. *p < 0.05, one-way ANOVA and Sidak’s multiple comparison test. Perfusion conditions: 1 min PBS; 59 min 1, 3 or 10 μM IBNtxA. (d) The percentage of Ca2+ -responding cells treated with 1 μM IBNtxA was reduced either by non-selective opioid antagonist naloxone or by the selective β2-AR antagonist ICI 118,551. Perfusion conditions: 1 min PBS-3 min 10 μM naloxone or 1 μM ICI 118,551;-56 min 10 μM naloxone/1 μM IBNtxA or 1 μM ICI 118,551/1 μM IBNtxA respectively. *p < 0.05, **p < 0.01, Student’s t-test vs. control.

