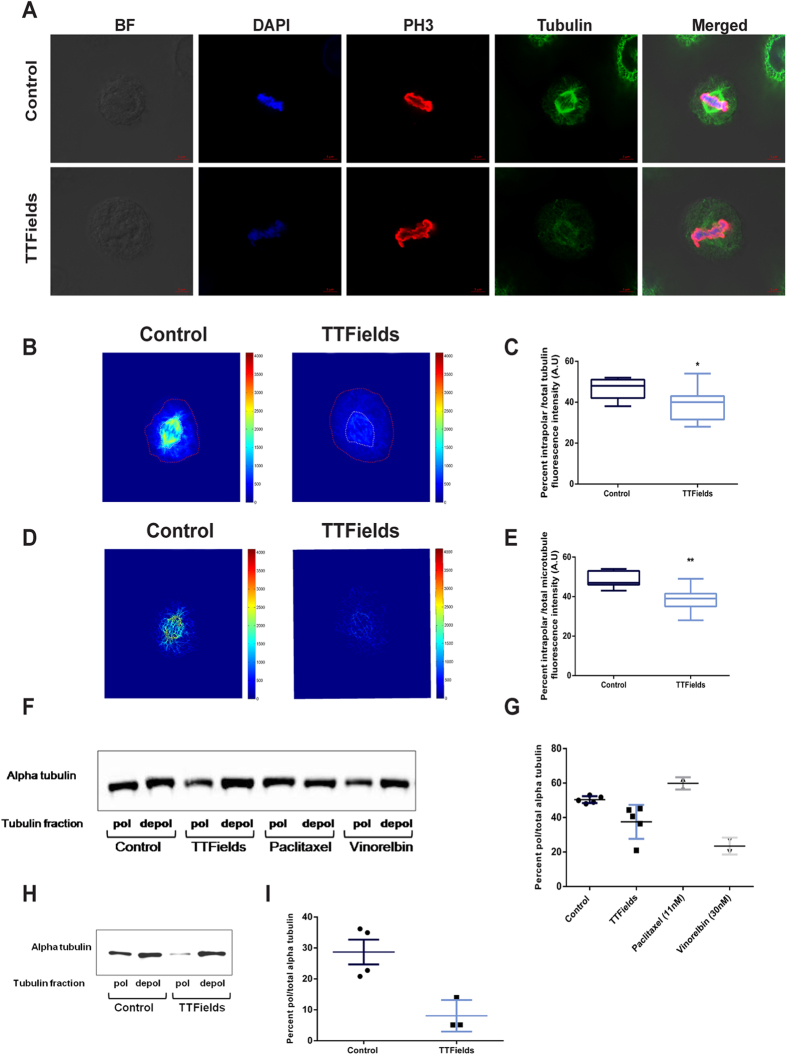
Figure 1. TTFields Treatment Induce Severe Mitotic Spindle Damage in Cancer Cell Lines.
(A–C) A549 cells were treated with TTFields for 24 hours. (A) Confocal fluorescence microscopy images of: Upper panel- normal metaphase alignment of chromosomes in control cell, Lower panel: metaphase alignment in TTFields treated cell. Blue, Dapi-stained DNA; Red, Phospho Histone 3 (PH3) stained chromosomes during mitosis; green, tubulin. The scale bar represents 5 μm. (B) Tubulin fluorescence images were inverted and pseudocolored so that increasing fluorescence intensity is indicated from blue to red (scale bar represent arbitrary units). Dashed lines define the region between the two spindle poles (white) and overall tubulin fluorescence within the cell (Red). (C) Box-and-whiskers plots show the percentage of fluorescence intensity defined by the spindle and poles in relation to the total sum of tubulin fluorescence within the cell. The boxes show the mean and the interquartile ranges, while the whiskers show the full range. (D) Z-stack based 2D visualization of the mitotic spindle structure in each cell following enhancement of the cytoskeletal filament networks. (E) Box-and-whiskers plots show the percentage of fluorescence intensity defined by the spindle and poles in relation to the total sum of microtubule fluorescence within the cell. (F,G) In a separate experiment cell lysates of A2780 cells were collected following 48 hours treatment with TTFields. (F) Immunoblot of polymerized (pol) and depolymerized (depol) tubulin fractions were compared to untreated cells and cells treated with paclitaxel or vinorelbin. (G) Graph represents the percentages of polymerized microtubules in relation to total tubulin. Horizontal bars indicate mean values with SD. (H) Immunoblot of polymerized (pol) and depolymerized (depol) tubulin fractions of cells treated with TTFields for 10 hours were compared to untreated cells, 16 hours after re-plating. (I) Graph represents the percentages of polymerized microtubules in relation to total tubulin. Horizontal bars indicate mean values with SD. 0.05 > *p > 0.01 and **p < 0.01 from control group.

