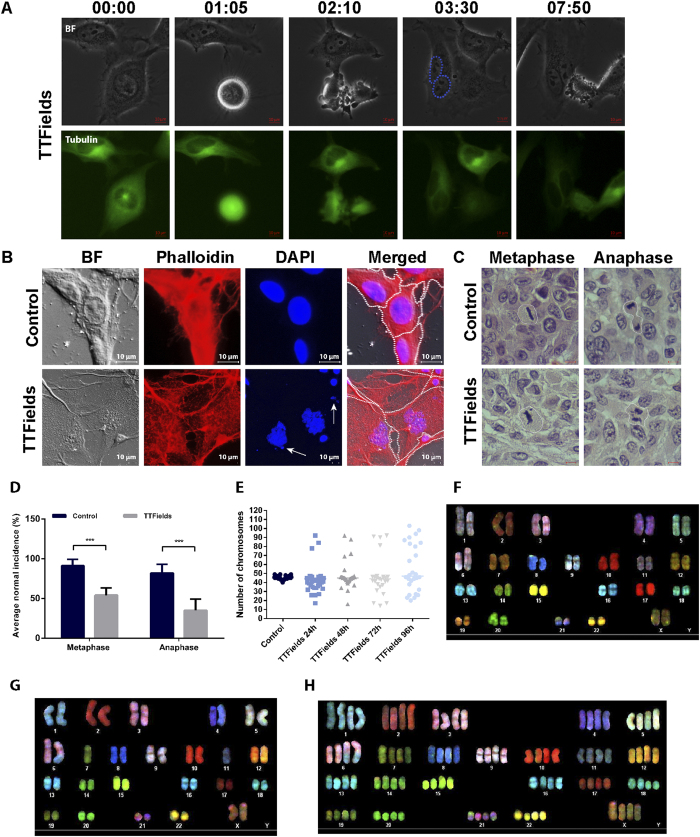
Figure 2. TTFields Application Induce the Formation of Multinuclear Cells and Chromosome Aneuploidy.
(A) Phase-contrast and fluorescent time-lapse analysis of nuclei formation in TTFields treated Tubulin-GFP HeLa cells. Dashed line defines cell nuclei following division. Numbers show elapsed time (hour:minute). The scale bar represents 10 μm. In a separate experiment, U-87 MG cells were treated with TTFields for 72 hours. (B) Upper panel, U-87 MG control cells. Lower panel, TTFields treated cells. Arrow indicates micronuclei structures. Blue, Dapi-stained DNA; Red, Phalloidin-stained Actin. The scale bar represent 10 μm. Dashed line defines cell boundaries. (C,D) Fischer rats inoculated intracranially with F-98 glioma cells were treated with 200 kHz TTFields for 7 days, 1 week after tumor inoculation. At the end of treatment, tumors were removed and evaluated for atypical mitotic figures. (C) Representative images of mitotic figures. White lines encircle mitotic cells. The scale bar represent 5 μm. (D) Quantification of normal mitotic figures is expressed as percentage. At least 120 cells in metaphase or anaphase were analyzed in each group. ***p < 0.001 from control group. (E) A2780 cells were treated with TTFields for 96 hours. Chromosome number was evaluated every 24 hours. Horizontal bars indicate median values (p < 0.0001 ; Brown-Forsythe test). (F–H) Spectral karyotyping of A2780 cells (46, xx, der(6)t(1;6)) showing numerical aberrations following TTFields treatment. (F) Control.(G) Hypodiploidy following treatment. (H) Tetraploidy following treatment.

