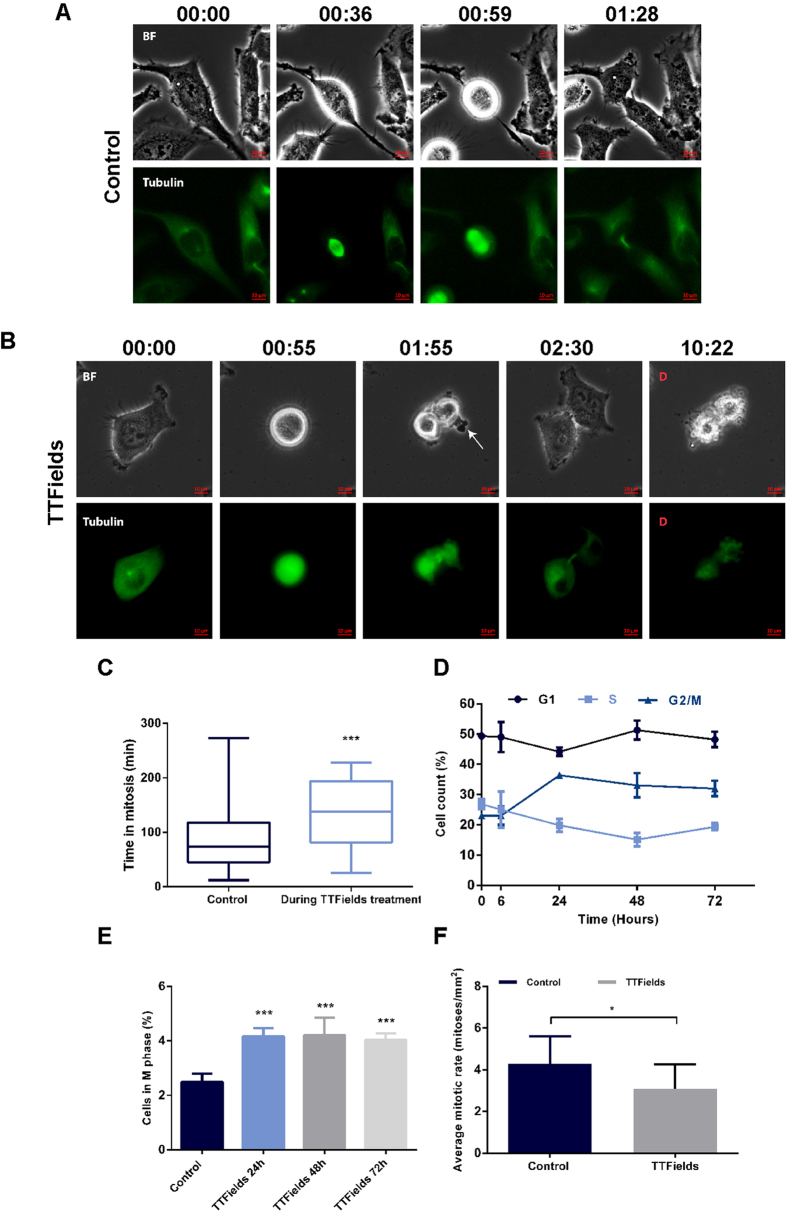
Figure 5. Mitotic Arrest and Mitotic Cell Death Are Possible Outcomes of TTFields Treatment.
(A–C) Phase-contrast and fluorescent time-lapse analysis of mitosis in Tubulin-GFP HeLa cells. (A) Control cells. (B) TTFields treated cells (8 h). Numbers show elapsed time relative to entry to mitosis (hour: minute). Arrow indicates membrane blebbing. Cell death is indicated as D. The scale bar represents 10 μm. (C) Box-and-whiskers plots show the time that cells spent arrested in mitosis. The boxes show the mean and the interquartile ranges, while the whiskers show the full range. (D,E) In a separate experiment, A2780 cells were treated with TTFields for 72 hours. (D) Cell cycle analysis was performed using flow cytometry. (E) Graph represents the change in percentage of A2780 cells in M phase following TTFields application. (F) Fischer rats inoculated intracranially with F-98 glioma cells were treated with 200 kHz TTFields for 7 days 1 week after tumor inoculation. At the end of treatment, tumors were removed and evaluated for average mitotic rate. 0.05 > *p > 0.01, ***p < 0.001 from control group.

