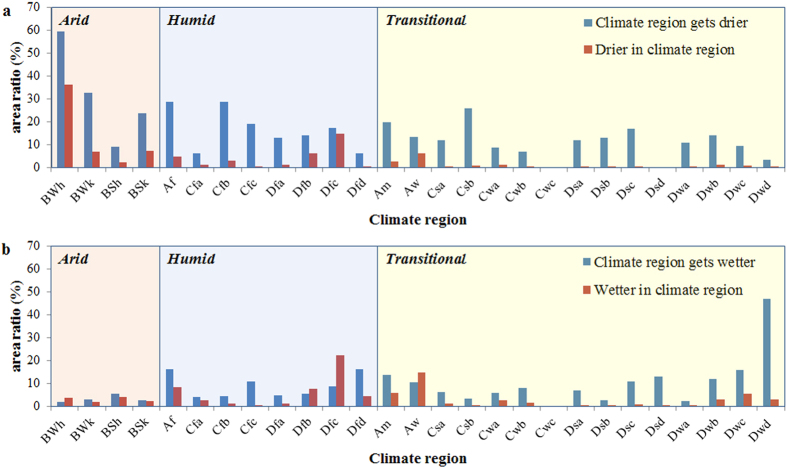
Figure 3. Statistics of the soil moisture trends.
(a), The drier trend, and (b), the wetter trend. The abbreviations used to label the X-axis refer to the climate regions, which are composed of two or three letters. The first letter refers to the climate types: tropical (A), arid (B), temperate (C) and cold (D). The second letter indicates the precipitation conditions: rainforest (f), monsoon (m) and savannah (s) in tropical, desert (W) and steppe (S) in arid, dry summer (s), dry winter (w) and without dry season (f) in temperate and cold climates. The third letter designates hot (h) and cold (k) in arid and hot summer (a), warm summer (b), cold summer (c) and very cold summer (d) in temperate and cold climates. “Climate regions get drier/wetter” is the ratio of drier/wetter area for a climate region. “Drier/wetter in climate region” refers to the ratio of drier/wetter area in a climate region to the total drier/wetter area. The sum of “drier/wetter in climate region” equals 100%. The figure was generated using Microsoft Excel 2010.

