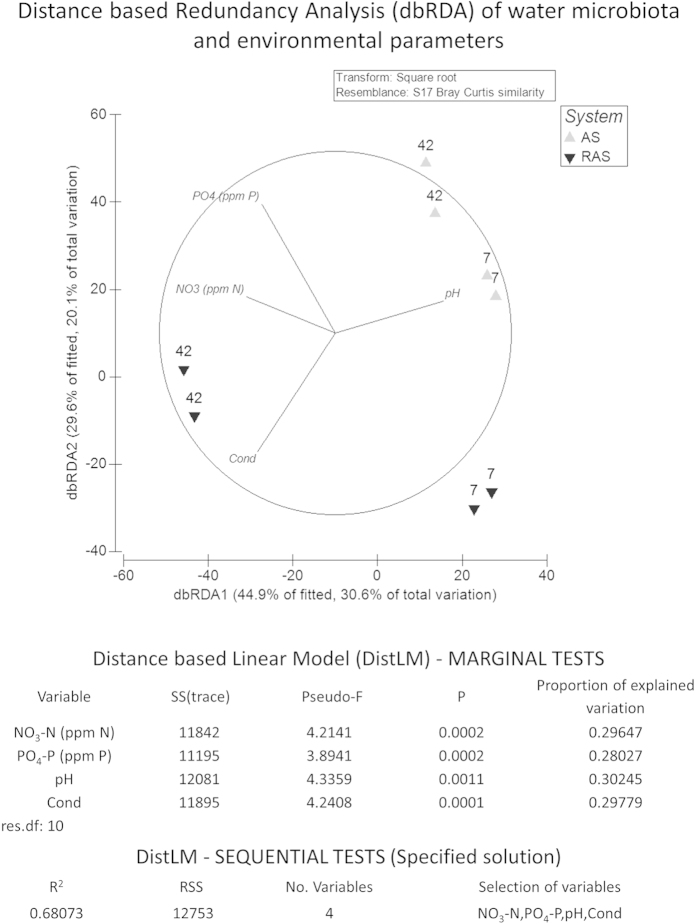
Figure 1. Distance based Redundancy Analysis (dbRDA) of water microbiota.
Relative position of water samples in the biplot is based on Bray Curtis similarity of square root transformed relative abundance at the OTU level. Vectors indicate the weight and direction of those water quality parameters that were best predictors of water bacterial composition as suggested by the results of the distance-based linear model (distLM). The dbRDA axes describe the percentage of the fitted or total variation explained by each axis while being constrained to account for group differences. Sample IDs indicate the sampling day (7 and 42) and the rearing system (AS & RAS: Active suspension and recirculating aquaculture system with two replicates each). NO3−-N: Nitrate nitrogen; PO43−-P: Phosphate phosphorous; Cond.: Conductivity.

