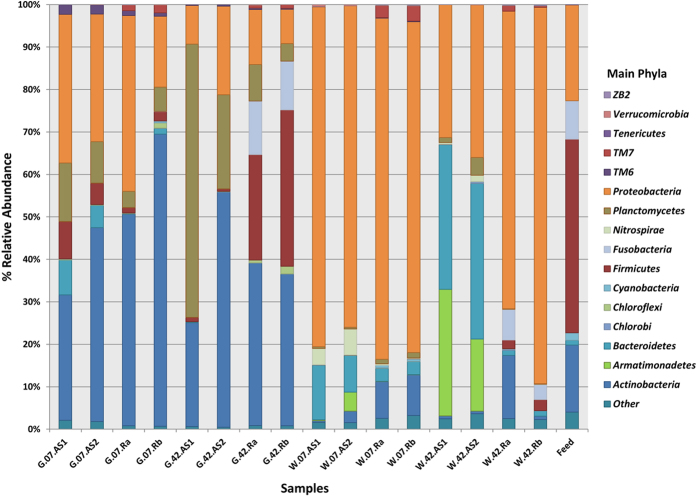
Figure 2. Cumulative bar charts of the main phyla present in either gut or water samples.
Percentages show the relative abundance of each phylum in the gut or water of each replicate system on either day 7 or 42. Phyla in the feed represent the average values of feed samples from both day 7 and 42. AS1 & AS2: Replicate active suspension system 1 and 2, Ra & Rb: Recirculating aquaculture system a and b.

