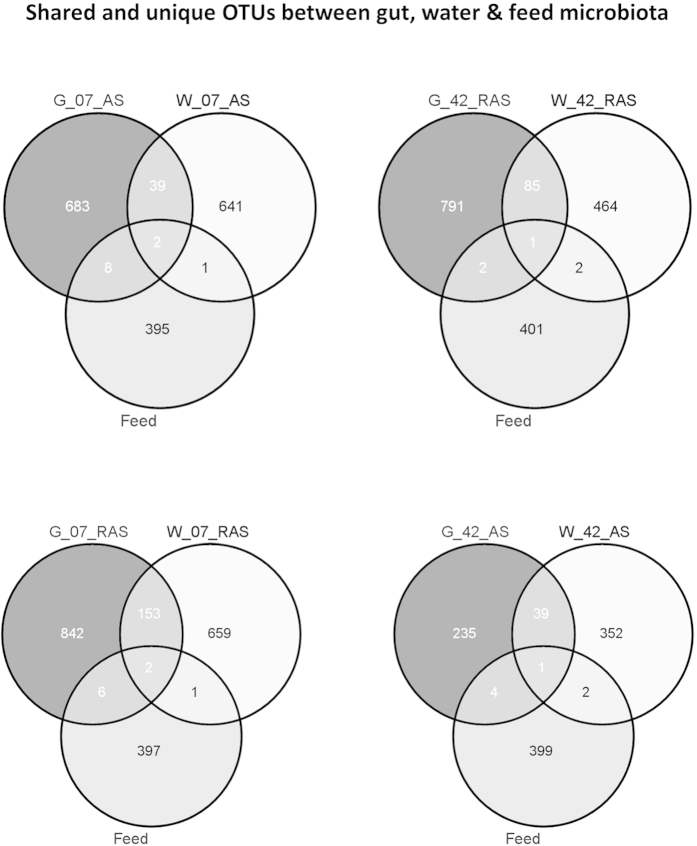
Figure 4. Venn diagrams of bacterial communities between sample types.
Number of reads in all samples was normalized to the minimum number of reads found in one of the samples (1719 reads). The Venn diagram illustrates overlap of bacterial OTUs between gut, water and feed samples for two different systems over time. Numbers inside circles indicate the number of unique OTUs in one of the subsets based on absence/presence data from replicate systems. Numbers of unique OTUs indicate those OTUs that were present in both replicate systems and in at least one of the samples within each replicate system. Numbers in the overlapping regions indicate the number of shared OTUs between subsets. AS & RAS: active suspension and recirculating aquaculture systems; 07 and 42: Sampling day 7 and 42 respectively.

