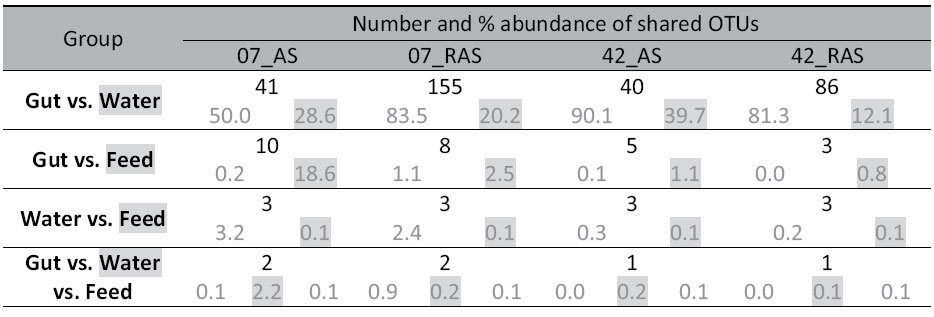
Table 6. Total number and percentage relative abundance of shared OTUs per system on each sampling day.

Shaded relative abundance values correspond to shaded sampling group in the first column. Sample types are compared within system for each days. OTU: Operational taxonomic unit; AS & RAS: Active suspension and recirculating aquaculture systems; 07 & 42: Sampling days 7 and 42 respectively.
