
Figure 5. Direct-to-indirect band gap transition of the Si(111)n/Si(SC) superlattices.
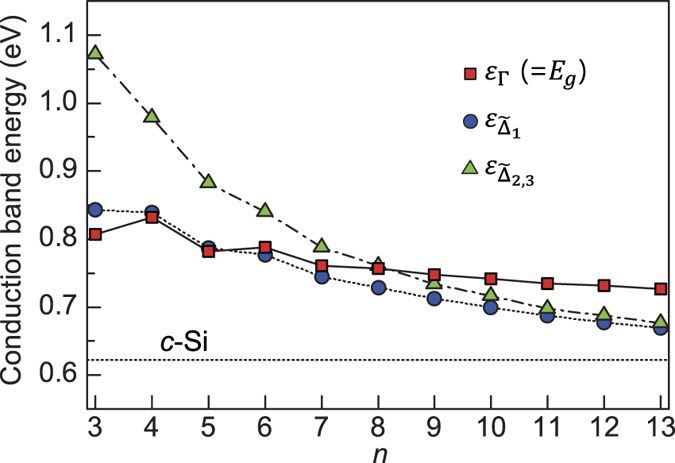
The lowest conduction band energies at the Γ,  , and
, and  points are plotted as a function of n and compared with that of c-Si (horizontal dotted line).
Official websites use .gov
A
.gov website belongs to an official
government organization in the United States.
Secure .gov websites use HTTPS
A lock (
) or https:// means you've safely
connected to the .gov website. Share sensitive
information only on official, secure websites.
The lowest conduction band energies at the Γ, , and points are plotted as a function of n and compared with that of c-Si (horizontal dotted line).